I’ve banged on about tax expenditure reliefs already. Twice, in fact: here and here.
I made a few points in those posts. We know tax expenditures are hugely expensive. They cost us – through tax revenues we don’t collect – more than £100bn every year. But no one knows quite how much they cost us because Government doesn’t collect the data. And no one knows either whether we get value for money from them because… Government doesn’t ask.
So in governance terms they’re – there’s no putting lipstick on this pig – a disgrace.
I also asked why this state of affairs persists?
Why is Osborne’s Spending Review focusing solely on cutting £20bn from already lean departmental budgets but doing nothing to trim the fat from the revenue side of our profit and loss? Why does he – quite literally – not want to know about the public costs and private benefits of tax expenditures?
What I want to focus on here is a few points about who benefits from tax expenditures. And I’m going to look at income tax expenditures.
There’s no published data – or at least none that I’m aware of – on this. That tells a story all of its own. But I think I’ve been able to reverse engineer some. So as not to clog up the narrative, I’ve set out in detail how I’ve done the calculations at the bottom. Do have a look: if I’ve got them wrong, obviously I’ll hold my hand up.
It is possible to extrapolate from Table 2.5 (with a little help from 2.6) for 2015-16 here something of how the benefit of tax expenditures is spread amongst income tax payers.
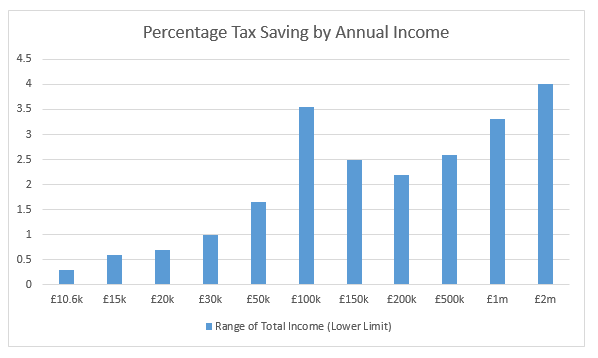
This first chart below tells you how much the average income tax payer in certain income brackets has their tax bill cut by (some) income tax expenditures.
The “(some)” is because as I set out at the bottom of this page the data only enables me to infer the distribution of a subset (about £13.5bn of more than £32bn of so-called ‘principal‘) of income tax expenditures. 
As you can see, if you earn more than £2m per annum (and the average taxpayer in this earnings bracket earns £4.76m per annum) you benefit (from income tax expenditures alone) to the tune of on average more than £190,000 per annum. But if your income is between £30,000 and £50,000, for example, they benefit you £382 per annum.
It is worth noting that the distribution of the remaining so-called principal income tax expenditures follows the distribution inferred here then you would increase those numbers by 240%. So the average income taxpayer in the £2m plus bracket would derive over £450,000 per year from income tax expenditures.
My second table shows that these tax expenditures do not only benefit high earners more in absolute terms. They also benefit high earners more in percentage terms. Put bluntly, they are regressive. This is exactly as you would expect: those paying higher rates of tax are more incentivised to seek out income tax reliefs. And those earning more are better able to engage in the sorts of activity that attract tax reliefs.
The third table shows you how the benefit of these inferred income tax expenditures is shared amongst some taxpayers.

As you can see the top 2% of income tax payers (which is broadly the top 1% of earners – because only just over half of over 16s earn enough to pay income tax) receive 43% of all inferred income tax expenditures. And the top 10% of income tax payers (the top 5% of all earners) receive 65% of all inferred income tax expenditures.
Startling though these results are, there is good reason to think them conservative. The (rather puzzling): “Allowances given as tax reductions” line in Table 2.6 here shows 70% of those “allowances given as tax reductions” going to the highest earning 1% of income tax payers.
The Calculations
Table 2.5 sets out for each of the earnings brackets (a) the number of taxpayers in that bracket, (b) the total income of those taxpayers, and (c) the total tax paid by those taxpayers. From (a), (b) and (c) you can calculate (and Table 2.5 does) the average rate of tax paid by those taxpayers.
For any individual taxpayer in that bracket you could identify what tax she would have paid after her personal allowance but before any other reliefs. Tax practitioners call this the ‘blended rate’ (it’s ‘blended’ from the personal allowance, basic, rate, higher rate and additional rate).
Of course we don’t have an individual taxpayer. But if we take (a) and (b) for each of those brackets we can construct what the average individual in that bracket would earn. I have taken that average individual and worked out her ‘blended rate’.
If you deduct the average rate from the blended rate you get a percentage which is accounted for by, I believe, certain types of tax expenditures.
You also need to take into account that not all income is taxed at the same rate. In particular, dividends are taxed at 10%, 32.5% and 37.5% rather than 20%, 40% and 45%. Pro-rated by number, this effect isn’t particularly material for basic rate taxpayers so I’ve ignored it for them. This will mean that the amount of tax reliefs inferred for basic rate taxpayers is overstated.
But for higher rate taxpayers, tax on dividends amounts to 10% of all the tax they pay. And for additional rate taxpayers it amounts to more than 14% of all the tax they pay (you can see this from Table 2.6 for 2015-16). By my calculations this difference will typically account for about 1% of the difference between the blended rate and the average rate for additional rate payers. And 0.75% of the difference for higher rate payers.
So I have deducted this (1%, 0.75%, or 0%) from the difference between the blended percentage rate and the average percentage rate.
If you then apply the resultant percentage to the gross income of that average individual in each tax bracket you can infer a tax reduction which is ‘unexplained’ by other means and which, it seems to me, must be attributed entirely (or virtually entirely) to tax expenditures.
Let me illustrate the calculation.
There are 5,000 taxpayers earning more than £2,000,000 per annum. They earn aggregate income of £23.8 bn. And they pay aggregate tax of £9.43bn. This gives an average rate of tax of 39.7%. The average taxpayer in that bracket has income of £4.76m per annum. Pre-reliefs, that taxpayer would pay income tax of £2,128,143 (a blended rate of 44.7%). 44.7% – 1% (dividend effect) – 39.7% = 4%. 4% of £4,760,000 = £190,400.
If you multiply £190,400 by 5,000 taxpayers you get the aggregate inferred tax expenditures enjoyed by taxpayers with income of more than £4.76m (or £952m). If you do that exercise for every income category you can then work out the figures in my third table. The taxpayer income percentiles come from here. They are from 2012-13 but the difference will be, in the scheme of things, modest.
The aggregate inferred income tax expenditures is about £13.5bn. By way of comparison the sum of the ‘principal‘ income tax reliefs for 2014/15 is something over £42bn.
For comparison, my results are more conservative than those produced by the (rather puzzling) “Allowances given as tax reductions” line in Table 2.6 here.
However, I can see no reason why the unaccounted for income tax expenditures should follow different distribution curves to those set out above. Indeed the (rather puzzling) “Allowances given as tax reductions” line in Table 2.6 here suggests that my analysis is conservative. It shows 70% of “allowances given as tax reductions” going to the top 1% of income tax payers.

I think it is absolutely right that the government should know how much the various tax expenditures cost so that there can be a sensible discussion as to whether or not they are value for money.
Based on the evidence you have put forward, they do look to be regressive. But you have achieved that by excluding the personal allowance (and not treating any income tax rate below 45% as a tax expenditure) and this distorts your tables. It would be interesting to see how your second table would look if you adjusted for these two elements.
Some of the other tax expenditures also include timing differences that will typically reverse some or all of the expenditure. It would be interesting to see if adjusting for this would change the conclusions.
Neither the personal allowance nor marginal rates of tax are tax expenditures.
Actually, the PA is in the government list
It is, but not as a tax expenditure. It’s a structural relief.
The *structure* of the income tax system sets up the basics of who has to pay tax, on what income and at what rate. The personal allowance excluding the first £10,000 or so of income from tax is part of that basic structure so is a ‘structural relief’. Tax would be paid on that income only if the structure were different. Given a particular structure, then something that lets people off paying tax that the structure would otherwise require is a ‘tax expenditure’ because it has the same effect as collecting in all of the tax that the structure requires and then spending some of the money by giving it back to people in particular circumstances. The HMRC tables refer to Married Couples Allowance as an example, and it’s quite a good one to illustrate the principle. If you take a group of people all earning the same amount then the structure of the tax makes them liable to pay the same amount of tax. But those who meet the conditions for the Married Couples Allowance would actually pay less tax than everyone else. The key thing to note here is that although it might be said that the couple are just keeping hold of more of their earnings, or just getting back some of what they have paid in, if government isn’t getting this amount from them, it has to be made up somewhere else. So the cost of the ‘tax expenditure’ in providing a Married Couples Allowance actually falls on everyone else, either through higher taxes, less actual government spending, or more government borrowing. For this reason, it’s very fair for Jolyon to draw attention to the fact that large amounts of ‘tax expenditures’ appear to benefit the richest disproportionally, and wonder why this should be so. Whatever one’s politics, more transparency here would clearly be helpful. In this context it’s interesting that in table 2.6 HMRC explain the £1,970 million of “Allowances given as tax reductions” with a footnote saying “In this context tax reductions refer to allowances given at a fixed rate, for example the Married Couples Allowance”. Other HMRC publications give the total cost of Married Couples Allowance as £280m, and so giving as the single example something that accounts for only 15% of the costs seems not designed to be quite as informative as possible. As HMRC will know what they added up to get the £1,970 million (and the £1,350 million of which goes to the teeny number of additional rate taxpayers), it would be interesting for a wider public to know too…
Reblogged this on perfectlyfadeddelusions.
It seems a bit odd to take one element of a tax system and complain that it is regressive. Surely what matters is the system taken as a whole, and as we know, those with the highest incomes pay a very large share of the income tax take.
As your numbers show, the top 5,000 pay nearly £10 billion of income tax on about £24 billion of income. If they get £190k each of tax relief by way of “tax expenditures”, that is about £1 billion in total. Are you complaining that this very small number of people should be paying £11 billion rather than £10 billion? That extra £1 billion is hardly going to balance the budget, it is.
So, which income tax reliefs are those with an annual income of over £2m claiming to get £190k each per year on average?
About two thirds of the £32 billion of “tax expenditures” relating to income tax reliefs – £22 billion – is due to pensions. That number appears to include tax relief on the income of pension schemes as well as relief on contributions. But, to remind people, who passed the 2004 Finance Act that allowed someone to claim income tax relief when they paid 100% of their earnings into a pension scheme? And who reintroduced an annual cap on the contributions attracting tax relief?
After pensions, another three “tax expenditures” relating to income tax account for two thirds of the remaining £10 billion – £2.6 billion for ISAs (which also have an annual cap on contributions), about £2.7 billion for tax credits (I doubt any in the £2m club are claiming them), and £1.7 billion for the income of charities (again, not the £2m club).
Very interesting.
Two quick thoughts. I’m reading on a phone and links don’t open well. So I’ll need to sit down later with the PC to look at.
Do you provide the composition of the aggregate inferred income tax expenditures of £13.5bn?
And surely we need to consider all the taxes/tax expenditures met/paid by a non-business person/household to arrive at any judgement of the degree to which overall Tax expenditures seem to benefit them? I’m thinking of things like the tax/NIC relief for pensions. Or the very large VAT figures (eg £17.45bn on zero rating food, £8.3bn on new housing and £4.8bn on energy). Would the latter not benefit poorer deciles dispropotionately because of the high impact on their personal spending?
If the personal allowance was universal, I’d agree with you. But a relief that is based on a combination of income and expenditure has the same qualities as a tax expenditure. The difficulty I have is saying something is regressive by only looking at a part of the whole.
I’ve mentioned this on Twitter, but I see no mention of charitable giving here. https://www.cafonline.org/about-us/publications/2015-publications/uk-giving-2014 estimates £10.6bn given by UK adults (does it include the relief? I assume so) in which case if you assumed a 90/10 rule then that would be c. £4bn of tax expenditures generated by giving? I am a layman in this area, but I do know that the number is proibably signifiicant.
[Another area I know about is EIS investing – I don’t imagine the quantum is that large?
30% upfront Income Tax relief (plus 100% IHT relief and CGT)]
Given an annual allowance of £40k for pension contributions, most of this £190k of relief must be coming from somewhere else. I’m struggling to see where this much relief can possibly come from.
Your broader point is of course fair: it is a bit absurd to focus only on the parts of the system that allow high earners to mitigate their otherwise very high exposure to tax. This is a bit like the recent study (it got a lot of coverage in the Graun) which claimed that the lowest earners pay the highest proportion of their income in tax. This is true if you include benefits received as part of income, so that even those who are in fact net recipients from the system appear to pay lots of tax.
Our tax system is only nominally progressive, more window dressing than reality. The wealthy are disproportionally advantaged. Article on where to find the £4.5 billion to save Tax Credits
http://www.voteyesborders.com/2015/11/tax-credits-saved-at-a-stroke/
According to the HMRC table of “Estimated costs of the principal tax expenditure and structural reliefs”, EIS income tax reliefs are about £350m in 2014-15. No doubt the distribution of EIS relief across income deciles will be heavily skewed towards the upper end, where people can afford to invest in illiquid and high-risk assets.
Does it matter if EIS relief is regressive in those terms, if it encourages investment? EIS relief is so hedged around with conditions that it is hard to use, let alone abuse.
Relief on charitable donations under gift aid and income of charities is about £1.7 billion. IHT relief on charitable bequests and gifts is about £600m.
That feature certainly makes it important to understand whether it delivers public value…
I think the research shows that the zero rate does not make food in the UK very much cheaper (compare the prices you pay elsewhere in Europe, where there is VAT).
In proportional terms, the lower income deciles spend more of their income on food, so the zero rate benefits them more; in absolute terms, the top income deciles get most of the benefit because they tend to spend more on food.
What do you mean by “public value” and how are you going to measure it?
That’s Government’s job. If there isn’t measurable public value we shouldn’t have the relief. It is just a bung.
So we have a conundrum. If it benefits the poor more in relative term does it matter if the rich gain more absolutely?
And is the same true for IT relief/expenditures?
Pingback: Autumn Statement Alternatives | Waiting for Godot
With respect, that is semantics. They both “cost” in terms of reduced tax revenues.
Is there really a functional difference between, say, exemption from VAT of domestic dwellings and zero rating of new build dwellings (i.e. exemption with input tax recovery)? Why is one impugned as “tax expenditure” and the other accepted as “structural”? They are both political choices.