Netting off tax and benefits

On Sunday I wrote about how the tax system, examined as a whole, isn’t nearly as progressive as George Osborne suggests. It’s regressive, in fact.

I gave the Office for National Statistics numbers for ‘quintiles’ – the lowest to highest earning fifths – of households. But here’s a chart for deciles which makes the point even more strikingly.

Capture.PNG

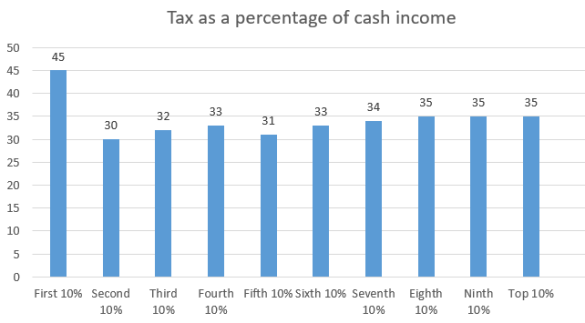
These are ONS numbers – taken from here – and they give tax as a percentage of the total of earned income and cash benefits.

The main culprit is Council Tax which – even after ‘Council tax support’ – consumes 9% of the total for the First 10% but only 1.5% of the income for the Top 10%. Every time – as with, for example, the Social Care Precept – Government chooses to fund spending through Council Tax you should be outraged. It is willfully choosing to dump those costs on the poorest because to do so is politically expedient. Collectively we understand but poorly the distributional effects of raising Council Tax. This enables Government to do what it should not without political cost.

But alongside the regressive nature of our tax system there is a related debate to be had about benefits.

Does it matter that the poor are disproportionately taxed if they disproportionately benefit from the benefits taxes fund? Is it the net effect of taxes paid and benefits received that one should analyse?

Of course, this is not what Osborne sought to do. The currency of political debate is ‘who bears the burden of taxation’. That political debate readily assumes, and often in ugly language (see this reference to “scroungers“), that the poor are beneficiaries of a burden borne by others.

But there is also a discrete, economic, debate.

This debate is also informed by ONS figures. Here are their absolute numbers for cash and other benefits in kind received directly from Government (see Table 14).

Capture

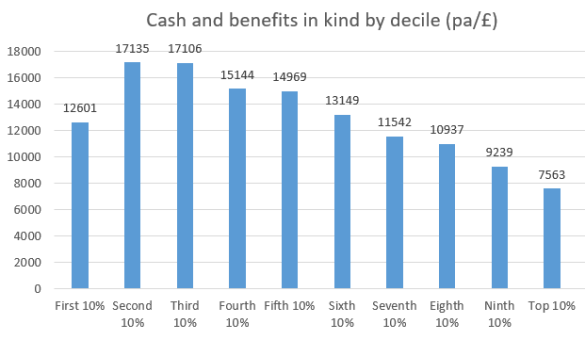
The explanation for these numbers lies, in particular, in the universality of the state pension; the fact that all deciles are substantial consumers of education and (in particular) the NHS; and the fact that the rail subsidy is disproportionately enjoyed by the rich.

Of course, looked at as a percentage of income rather than in absolute terms, the poorer deciles benefit more than this chart reveals. But in absolute terms the differences in the extent to which the deciles benefit directly from Government are far less profound than you may expect.

I use this phrase “directly from Government” quite deliberately. The ONS figures capture those benefits we receive directly. But they do not capture those benefits we receive indirectly. They do not capture the extent to which the wealthy benefit from the infrastructure that enables income to be generated and wealth to be protected.

If we analyse who are the big beneficiaries of that infrastructure – of the legal system that enables income to be generated and protects property rights, of the police and army that secure our wealth from confiscation by acquisitive forces, of all the complex systems that Government provides and sustains and which enable us to earn our incomes – it is self-evidently the wealthy and high earners who benefit most.

Is there some argument that requires that we have regard to the direct benefits our tax system funds – but that we ignore the indirect benefits? If there is, I do not see it.

Of course, we should all benefit – as economic agents and as moral beings – from the social compact to which we, willingly or unwillingly, subscribe. We are, as George Osborne observed in the quote with which I began this discussion, “in it together.” True, we benefit differently. But we must each contribute according to our means.

Postscript:

Here’s Andrew Jackson’s chart (see ‘Comments’below) of net direct contributions (I have re-titled his chart but the data is his).
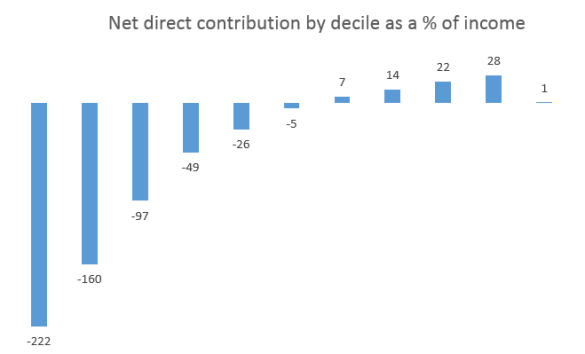
Capture

Andrew adds:

“At first glance it looks very odd that the negative bars are so much bigger than the positive even though the total is 1%, but of course the negatives are percentages of much smaller numbers so this is to be expected.

“The other odd thing is that it comes down to only 1% difference, implying personal tax and benefits are largely breaking even; presumably other taxes cover all other spending.  Although with council tax in there but local services excluded, that is also odd. In fact, the more you look at this the more you realise what is not included, at least in the way of benefits… but it’s a start.”

The wealthy and the tax burden

Here’s what George Osborne said in his Budget speech:

Capture

Income tax represents almost 32% of all the tax we receive so this is a not insignificant statistic. But is it right?

It is, in fact, very wrong indeed. It would be more accurate to say that the highest earning half a percent pay 28% of all the income tax we receive. But it’s important we understand why this is. And what it tells us about whether we really are “all in it together”.

A high proportion of income tax revenue being paid by a small proportion of earners might be because we have a progressive tax system. Or it might be because we have income inequality. Either would deliver this result. But only one of them would be thought a positive political achievement.

Our system for taxing income is not nearly as progressive as you might think.

On income over £10,600, you will pay tax – including National Insurance Contributions – of 32%. On income over £42,385 you pay tax of 42% and on income over £150,000 you pay tax on income of 47%. But tax on income – excluding National Insurance Contributions – is more progressive.

George Osborne gave us the figure for income tax. Because it is our most progressive tax it overstates both the proportion of tax paid by high earners and the proportion of tax on income paid by high earners.

What about the alternative, income inequality?

From 2010-11 to 2015-16, the number of people earning more than £500,000 grew 44% from 32,000 to 46,000. And the number earning more than £2m per annum grew by around 500%. But this (it should be noted) only returned us to roughly pre-financial crisis levels.

And it wasn’t merely the number of high earners who increased – but also the amounts they earned. The amount earned by the average earner in that £500,000 plus bracket increased 16% from £1.122m in 2010-11 to £1.3m in 2015-16. By way of rough comparison, average weekly earnings grew from January 2011 to January 2016 by about 7%.

What about the tax paid by the average earner in that £500,000 plus bracket? It increased too (from £472,000 in 2010/11 to 514,000 in 2015/16) but only by 8.9%, much less than the increase in earnings. This is, of course, because of the cut in the top rate of tax from 50% to 45%.

So both are contributors.

One final point.

If you want to understand how progressive our tax system is, you really should look at it as a whole rather than focusing (as Osborne did) only on its most progressive element (income tax).

Looked at as a whole, the lowest earning 20% of households is the most highly taxed. That 20% pays 38% of its cash income – including benefits – in taxes. The second ‘quintile’ pays 30% then 33% for the third, 33% for the fourth and 35% for the top 20% (see Table 1 here).

This is because pretty much all of our other taxes are regressive. Big shout out to Council Tax which – even after Council Tax Support – consumes 5.8% of the cash income of the lowest earning 20% of households but only 1.8% of that of the highest earning.

If the Conservatives really did want a more progressive tax system they could start with that.

Coming Unstuck

The Chancellor’s plans to eliminate the deficit were always going to come unstuck.

Do not fear. I do not blog to advertise my lack of knowledge of macro-economics. Why would I, when that market is already so crowded?

I do not blog today on the effects of cutting public spending on growth. Nor, although previously I have elsewhere, do I mean to point to the consequences of Osborne’s decision to narrow our tax base. Nor, although I will, his relentless focus on cutting tax for corporations – beyond our G20 peers, beyond that which influences their investment decisions, beyond even that which they ask for. Nor, although it is something the OBR has persistently pointed to, will I point to the fact that Osborne’s deficit reduction plans rely in good part on asset sales rather than balancing income and expenditure.

No, the reason why Osborne’s plans were always going to come unstuck is a function of simple arithmetic.

Assume my spending remains constant at 100. To fund that spending I must have receipts, every year, of 100. Over five years to fund spending of 500 I must have income of 500. That five years is important because it’s the time horizon over which we plan our nation’s spending.

If my income is not 100 a year but 85, I have a problem. You might think, and rightly so, that I am 15 short. This Government has been 15 short.

What it has done, to hide that truth, is accelerate a whole bunch of 15s from later years into earlier years to hide the shortfall. Which is fine in earlier years – your budget looks balanced – but it leaves you in those later years with a shortfall of 30: the 15 you had anyway and the further shortfall consequential on you taking 15 from those later years for use in earlier years. Instead of having 85 you’ll only have 70. It’s not that complicated: if you spend tomorrow’s money today, you won’t have it tomorrow.

For a number of years, this is what we’ve been doing. On an extraordinary scale. Did you see those italics? Good, because I’m going to come back to them. And we’re now looking at a whole bunch of 70s.

You don’t believe me? Let me give you some examples. I don’t need to go back too far to justify those italics.

I’ll start with the Autumn Statement 2013. The Chancellor announced “follower notice” provisions which brought into earlier years £670m of receipts from tax avoidance cases that were expected to be won in later years. In Budget 2014, the Government dramatically extended the scope of the follower notice provisions with some “accelerated payment notice” provisions that moved a further £3.9bn from later into earlier years. A few points about these sums: of course, they moved money from later years into earlier years. But they also treated “possible” wins as certain. And they treated one off sums – resulting from a huge stockpile of tax avoidance litigation – as ongoing income.

But Budget 2014 didn’t pull this trick once. It pulled it twice.

Government knew that if you released pensioners from the obligation to buy an annuity from their pension funds and allowed them instead to withdraw cash lump sums they would. And when they did, income tax that would otherwise have been paid later on that annuity would instead be paid earlier, on the cash lump sum. Government would get the tax in the cash withdrawal year – but it wouldn’t get it in the later annuity years.

What was styled ‘pension freedom’ brought £3.05bn from later years into earlier years.

On to that year’s Autumn Statement. If we make a profit in tax year one but have made earlier losses, we can set those earlier losses against the tax year one profit and avoid paying corporation tax in tax year one. Government decided it wouldn’t let banks deduct their earlier losses against all of their tax year one profits: instead it would only let them deduct earlier losses against half of those tax year one profits. This would increase the Government’s take in tax year one but would also, of course, mean that in future tax years banks would have more losses available – because they wouldn’t have been set against tax year one profits. The result would be to increase the tax paid in earlier years and reduce it in later years.

By this mechanic, the Government brought from later years into earlier years the sum of £3.48bn.

In the March Budget of 2015 Government addressed its mind to those who’d already bought annuities. If we allowed them to sell those annuities, the same thing would happen as those who had yet to buy annuities. Those selling them would be in a position to make cash withdrawals giving rise to a tax liability now – rather than a later tax liability on payments under the annuities. This extension of pension freedom dragged a further £820m from later to earlier years. There was also an extension of the accelerated payments regime dragging in a further £550m from later into earlier years.

This all continued after the election. In the Summer Budget 2015 Government advanced the date at which big corporations had to pay their corporation tax. This brought an extra £7.83bn into earlier years. It wasn’t lost from later years – but it was a one off boost which made it look as though we had an extra £7.83bn of ongoing receipts.

In the Autumn Statement 2015 we repeated the ‘advancing the tax receipts’ mechanic, but this time for capital gains tax on residential properties, bringing into earlier years a one-off boost of £1.16bn.

And in last week’s Budget 2016 Government extended the Autumn Statement 2014 restriction on loss reliefs for banks and other companies, bring from later years into earlier years a further £3.36bn.

This isn’t over – the Making Tax Digital project will create an enormous one off boost – quite possibly in the tens of billions of pounds – to public finances in earlier years. This boost will flatter the real condition of public finances but won’t alter the underlying reality.

Even ignoring the Making Tax Digital boost, and only looking back to the Autumn Statement 2013, this combination of measures has brought £24.82bn into receipt for the five year timescale of earlier years. Much of this sum represents a one off boost; much of it will worsen the state of public finances in later years; none of it is repeatable; and all of it is matched against on-going expenditure.

And those later years? We’re looking at them now.

Be afraid.

Discriminating against the State

One of the odder measures in today’s Budget is this (from George Osborne’s speech)

Capture

In principle, it is welcome.

I explained here that self-employed workers are favourably treated for tax purposes, that a worker’s status as self-employment delivers very valuable benefits to her engager, and that personal service companies are abused to denude the Government of much needed tax revenues and workers of valuable employment law rights.

This measure carries a predicted yield of £555m over the life of the Parliament and appears to be exactly the measure I argued for here.

The curiosity is why it is confined to public sector employers?

George Osborne gives us no clue. Nor does the Office for Budget Responsibility’s Economic and fiscal outlook. The closest we get is in the Red Book:

Capture

But this reasoning is not particular to the public sector. Everyone, surely, has a responsibility to ensure that the people working for them are paying the right tax?

The abuse is far from public-sector specific. Indeed I argued here that the private sector is the environment in which the behaviour has its most destructive impacts – of distorting competition and destroying ‘good’ businesses. And the types of environment in which it is most likely to be seen are in the private sector:

Capture.PNG

This Select Committee report, too, suggests that personal service companies are most often used in the private sector. And Government has already tackled public sector abuse through this Procurement Policy Note.

But of course, everything has a reason.

What we do know is that it will put the public sector at a competitive disadvantage compared with the private sector. It will be difficult for public sector organisations to engage workers on a self-employed basis: they will bear the risk of getting wrong the assessment that a worker is self-employed. They will be driven to engage workers on an employed basis to avoid that risk – and this will increase their wage bill by up to 13.8%. The private sector will continue to be able to transfer that risk to the worker – or his personal service company. The private sector will, in effect, be able to buy the same worker for 13.8% less.

Why might this result be desired?

I can think of only one explanation.

Were you wanting to shrink the State; to force more outsourcing; to pass public money to big outsourcing companies… you might tilt the playing field. You might do this.


The future of tax avoidance

We don’t know much about tax avoidance. Not how much it costs us. Nor how to stop it. We barely know what it is. But we’re pretty sure we don’t like it. And we now know – thanks to Deutsche Bank and UBS – that the Supreme Court doesn’t either.

Last week’s decision concerned a scheme dating back to the early 2000s. Glory days for tax advisers who found, come bonus round, a willing buyer in every board room in City. The Deutsche Bank and UBS arrangements were variants on a scheme that lasted a number of years. You’d line up willing – and few weren’t – participants. To them you would deliver, instead of a cash bonus, shares in a cashbox company. It would declare a dividend in the amount of the cash bonus. Employees would pay a lower rate of tax – or even none at all.  And there’d be a nice little NICs saving for you too.

We barely noticed, prior to 2008, this stuff. And when we did we didn’t care. But true to history – which tells us tax avoidance is the most reliably pro-cyclical industry of all – this all changed with the financial crisis. Who could we find to blame? Whose shoulders might bear the burden? From whose had it, well, slipped a little?

We soon found out.

That our judges sit aloof from the winds of public opinion is an article of public faith. But the faith of tax lawyers quickly lapsed. Points that, before the financial crisis, HMRC lawyers had regarded as so hopeless as not even to bother to argue acquired, a mere few years later, the fixed status of orthodoxy.

The speed of this process caused concern in the legal community. Government appointed a ‘study group’ to help it decide whether to adopt a General Anti Abuse Rule to tackle tax avoidance. That group included, amongst others, a retired Law Lord and a serving High Court judge. It agreed, unanimously, that when confronted with avoidance judges adopted a “stretched interpretation” to the law. And quite how stretched depended on how much her or she disapproved of the transaction before her.

The GAAR was to solve all of this by giving judges an objective legal framework within which they might articulate their instinct to fairness. But it’s now been on the statute books for almost three years and a judge has yet to have the chance to use it. So the judicial activism continues.

Both Deutsche Bank and UBS had enjoyed success in the lower courts. Judges had not been able to find in the language of the legislation an intention that the bonuses should be taxed as HMRC contended.

But you didn’t need to read further than the first paragraph of the Supreme Court decision to know that this time would be different. When judges start the conversation with talk of the “sophisticated attempts of the Houdini taxpayer to escape from the manacles of tax” it’s rarely as a precursor to offering the tax freedom our would-be Houdini desires. It found that the result contended for by the banks would be “positively contrary to rationality, bearing in mind the general aims of income tax statutes” and dismissed their arguments.

A thrilling denouement to the story of tax planning. Few politicians intend that the highly paid should be able to apply the expensive emollient of good tax advice to slip the shackles of taxation. Not least because the British public, unlike those who flocked to Houdini, tend not to applaud when they do.

But is an extra set of judicial leg-irons really a good thing?

Yes – if your mind’s eye sees a judge who wears a blindfold and balances the scales with an invariable thoughtfulness and care. But there are reasons to be cautious too. There are times when we genuinely don’t know whether a transaction is “avoidance”. And if the reality does look like that subscribed to by the GAAR study group – judges applying a personalised sniff test – our tax system could come to deliver a little less than law and, sometimes, only a little more than popular opinion.

The UK’s tax competitiveness

Here’s what the FT reported this morning:

Capture

Ouch. That doesn’t sound so good. More tax cuts for multinationals must be the answer, right?

That’s what you’d think from the responses from Government:

Capture

But is that really what the KPMG ‘league tables’ show? Do we really need “further improvements” (for them, that is. You and I would probably describe it as collecting even less tax from multinationals)?

Here’s the KPMG Survey. It has lots and lots of questions comparing our ‘tax competitiveness’ with that of other nations. And business is asked over and again what would help our ‘tax competitiveness’. And they have lots of suggestions which result, unsurprisingly, in them paying less tax.

But when I take my three daughters into an ice-cream parlour and ask them whether they’d like ice-cream they tend to say yes. There’s not a single question in the KPMG report which seeks to assesses whether those tax breaks are in any way decisive of a decision to invest here or not.

This is close as the reports gets:

Capture

You’ll note the tiny sample size. You’ll also note that “high influence” is counted together with “some influence (and is not disaggregated). It could perfectly well be – indeed I would guess – that the number saying it has “high influence” is lower than the number saying it has “no influence.”

You don’t believe me? Well, here’s what the selfsame KPMG survey showed in 2014 (where they did disaggregate ‘high’ and ‘some’):

Capture

In 2013, the number saying the tax regime has “no influence” on where they located their activities was a staggering 350% of the number saying “high influence”.

And the report contains no analysis at all of the costs and the benefits for us as a nation of cutting the tax burden on business.

You see, at 20% we already have a corporation tax rate which is by far the lowest in the G7 and the joint lowest in the G20. Those other G20 nations with a 20 per cent rate? Russia, Saudi Arabia and Turkey. And are there really businesses contemplating setting up in Saudi Arabia who might be induced to set up here instead with a 2 per cent cut in corporation tax?

Nine years ago the rate of Corporation Tax was 30 per cent; today it is 20 per cent. In his 2015 Budget Osborne announced plans to cut it further to 18 per cent. That cut alone will cost £2.5bn in its first year. And that’s not my number, by the way. It’s HM Treasury’s own number – you can read it at Table 2.1 here. So “tax attractiveness” carries a very meaningful cost.

And the effect on Foreign Direct Investment in the UK – not the only measure of success, granted, but perhaps the one most applicable to the KPMG survey? Here’s the ONS’s chart.

Capture

In 2005, our rate of corporation tax was 30%. As it was in 2007.

You might think the KPMG report is a naked pitch for business to pay less tax. Dressed nicely for dinner, for sure, the better to be able to engage policy-makers and the electorate. And journalists. But still, just a pitch.

What do we actually get for foregoing the tax revenue – the “further improvements” described by Treasury? The effects of the greater “tax attractiveness” described by KPMG? And is it worth it?

We have no idea.


David Cameron and Corporation Tax Receipts

Here’s what David Cameron said at PMQs this afternoon:

Capture

But is this true? Or, like George Osborne’s claim on income tax receipts last week, is its relationship with the truth a fleeting one?

The General Election in 2010 was on 6 May 2010 – a month into the 2010/11 tax year.

Our corporation tax receipts in the 2010/11 tax year – according to HMRC’s own figures (page 8) – were £43.040bn. In the year 2014/15 – the last year for which figures are available – they are £43.005bn.

That’s not a 20% rise. It’s a small fall.

Of course, it’s worse than that because since 2010/11 the economy has grown modestly, tax receipts generally have grown, and there has been modest inflation. Yet corporation tax receipts have still fallen. This is exactly as HM Treasury predicted as it attributed significant costs to these cuts – £2.475bn in the year 2020-21 alone for the cut to 18% made in the Summer Budget.

Perhaps there’s an explanation. But I can’t see it.

Postscript: Iain Campbell points out that in 2009/10 receipts were (at £36.628bn) a sum a 20% increase to which gives you that recorded in 2014/15. If that is the ‘explanation’, Cameron is taking ‘credit’ for policies that Labour introduced: the first cut to Corporation Tax under the Coalition took place with effect from the 2011/12 tax year. It also invites the observation that in 2008/09 corporation tax receipts were £43.927bn: materially higher than now they are even in cash terms.

How much will it cost us to cut the top rate of tax?

Earlier this week, George Osborne came close to suggesting that by cutting the top rate of tax from 50% to 45% he had increased tax revenues by £8bn. The relationship between that suggestion and the truth is a distant one as I explained here.

Its evident falsity does not, however, make it any less convenient to those whose constituencies, or pocket-books, would benefit from further cuts. And so, predictably, it has precipitated a number of calls for those further cuts – perhaps in the coming Budget.

It is, unfortunately, recondite in these times to want to make policy by  reference to the evidence rather than the heroic assertion of that which is convenient. Be that as it may, here’s some evidence: about who it is who pays the top rate of income tax; how much they benefit from cutting it; and how much it costs the public finances to make that cut.

In this tax year, about 332,000 people will pay the 45% “Additional Rate” of income tax. That’s about half a percent of the population. About 83.5% of them are male. More than 332,000 people earn more than £150,000 per annum – the earnings level at which you begin to pay the top rate – but the tax system offers reliefs to reduce your taxable income, and these reliefs are overwhelmingly accessed by higher earners, as I showed here.

The mean average earnings of someone in the Additional Rate category of earner is a bit over £400,000 pa. That means that more than half of the income of that mean earner is taxed at the Additional Rate. If you are one of the 16,000 people earning over £1,000,000 pa, your mean average earnings of £2.43m pa means that virtually all of your income is taxed at the Additional Rate. If you earn £2.43m, a cut of 5% in the top rate of tax will give you an extra £120,000 in your pocket every year.

In total, Additional Rate payers will pay a bit over £30bn in income tax this year. So if you cut the Additional Rate from 45% to 40% you will give them, collectively, a tax break of more than £3.3bn.

This won’t, however, cut what Government receives by £3.3bn.

Most people aren’t keen to pay tax and when we raise income tax rates we increase the incentive to find ways to avoid that increased burden – either by engaging in tax avoidance, or by retiring early, or working less or leaving the country. When people give up work or work less or emigrate they don’t just avoid the increase in the rate of tax, we also lose the rest of the tax that they pay.

So there are reasons to be cautious about raising rates of tax. But, of course, people who are highly motivated by tax rates tend to live in low tax jurisdictions – they are not in the UK in the first place. As the FT put it earlier this week:

Capture

These considerations also act in reverse. When you cut tax rates you can decrease people’s desire to avoid tax, you can increase their inclination to work or work on, and to move to the UK.

We typically call this relationship between the tax take and changes in rates the Laffer Curve. But, as I’ve written here, calling it ‘the’ Laffer Curve is a misnomer because there isn’t only one Laffer Curve – there are different curves for different taxes, at different times and in different economies. And the shape of the curve is affected by a huge number of variables including, in particular, how easy it is to avoid tax.

Back in March 2012, George Osborne announced that he would reverse Labour’s decision to increase the top rate of tax to 50% with effect from 6 April 2013. At the same time as making that announcement HMRC released a paper called ‘The Exchequer Effect of the 50 per cent additional rate of income tax.’ That paper is the only public study of which I am aware into the effects of increasing or decreasing the top rate of income tax in the UK. It concluded that cutting the rate from 50% to 45% would cost around £100m per annum.

However, there is no room for doubt but that cutting the top rate from 45% to 40% would be considerable more expensive.

First, our inclination to alter our behaviour as tax rates change is dynamic. The lower the top rate, the weaker the incentive to change behaviour to avoid it. You can tell this is so because otherwise, by cutting rates to zero, we would raise more than the £163bn we presently receive in income tax. Plainly this is not so. So a cut to a lower top rate (45% to 40%) will cost more money than a cut to a higher one (50% to 45%) – even where exactly the same people are affected.

Second, the Coalition had marked success in tackling personal tax avoidance. One of the arguments as to why cutting rates will not lead to a reduction in tax receipts is that the incentive to avoid tax will weaken. But if it is already extremely difficult for high earners to avoid tax, it cannot sensibly be argued that diminished incentive will have a marked effect.

Third, pay growth in the top percentile of earners – roughly equivalent to those who pay income tax – is strong as this HMRC chart shows:

Capture
The number of those earning above £150,000 is projected to grow by 6.5% from 2014-15 to 2015-16 alone. And the aggregate taxable earnings of that group will grow by over 6% (both calculations from data here). As more income becomes subject to that top rate of tax the cost of cutting it increases.

Writing in the Telegraph last week Fraser Nelson said this:

The top rate of tax is, today, 45p but it was 40p throughout the Labour years. And for good reason: it was the optimal rate, taking the most from the highest-paid. If Osborne were to restore the 40p rate, he’d squeeze far more tax from rich and again demonstrate Conservatism in action.

Now, this is heroic asserting by Fraser. But, if you have regard to the actual evidence, there isn’t room for serious doubt about the effects.

Cutting the top rate of tax will deliver to the top 0.5% of earners a tax cut worth £3.3bn. And it will cost the Exchequer very considerable sums of money. My opinion is that these sums are more likely to be counted in the billions rather than hundreds of millions per annum.

Facebook and UK Corporation Tax (2)

Writing yesterday, I addressed the propensity of certain journalists to ready excitement. I examined what the Facebook deal didn’t mean. Today I want to write a little more on what it does mean. What is the likely thought process that led Facebook to this point? And how much cash is it likely to involve?

First, the thought process.

As David Quentin discusses – in an influential piece of work here – for the sophisticated player tax planning is essentially an exercise in managing tax risk. It involves a choice to seek to reduce your tax liability, which choice carries the the cost of embracing more tax risk. If my assessment of the risk as low is right, I save 100. If my assessment of the risk is wrong, I give back that 100 and I suffer the public embarrassment of fighting and losing a tax case.

I will revisit this equation in future weeks: it doesn’t operate in the public interest. But what I want to cover now is how it affected Facebook’s decision as to where to book UK sales.

Facebook understood – as did Google before it – the diverted profits tax to have backfired. It did not have the consequence of bringing Facebook within the (punitive) 25% diverted profits tax net. What it did do was increase the risk profile attached to Facebook’s tax planning. On the left side of the balance sat the prospective tax savings; on the right sat a now enhanced tax risk. But another factor sat, too, on the right hand side of the balance: the cost attached, especially for a consumer facing business like Facebook’s, to the negative publicity attendant on paying too little tax.

You weigh that tax saving against the increased tax risk and impact of that publicity on your global brand and, ultimately, you make a call as to which side of the balance sits heavier. That would have been the assessment that led Facebook’s to rework part of its UK tax calculation.

But what sat on the left side. What was the actual sum on the left hand side of the balance in my calculation. Can we know?

We would need to know (1) what sales were made by Facebook to UK customers. Of these sales, what subset (2) were effected by UK relationship managers? (You will recall from yesterday’s blog post that only these sales, and not advertising bought by smaller customers online, are affected by the announcement).

Then what profits were generated by selling – as opposed to other parts of Facebook’s value chain (3)? Under existing international tax rules the UK can’t tax what you might think of as ‘manufacturing’ profits here, only ‘retailing’ profits.

Finally, one would apply to those profits (4) our prevailing rate of corporation tax.

As to (1), the latest year of accounts available (for Facebook Ireland Limited’s accounts, where European sales have been booked up to now) gives European sales of €4.8bn in the year to 31.12.14. It doesn’t say what UK sales are, but the relationship of the UK’s GDP to that of the EU (18%) might give you a reasonable proxy for the proportion of sales made in the UK. 18% of €4.8bn would represent €860m. Divide by 1.3 to convert to £ would give you UK sales of £660m.

As to (2), we know that Google generates 60-70% of its sales from 1% of its customers. Let’s assume that the same is true of Facebook: that 1% of customers are serviced by the UK relationship managers, and they generate a (mid-range) 65% of sales in the UK. That would give you 65% of £660m of UK sales, or £430m of sales booked in the UK.

As to (3), worldwide Facebook appears to have a 40% margin (of pre-tax profits/turnover). Attribute, for the sake of argument, 10% of that margin to selling and the remainder to generating and maintaining the technology and intellectual property rights. That would imply a profit on those UK sales of 4%, or £17m.

If you apply to that £17m our 20% rate of corporation tax, you’d arrive at a UK corporation tax bill of £3.4m per annum on those sales. That’s a little less than, but not of a completely different order to, the £4-6m (independently) estimated by Tim Davies, Head of Tax at Mazars, yesterday.

As I explained yesterday, the deal is forward looking. It will apply from April 2016 going. So we won’t see any signs of it in the accounts for the period to 31 December 2015 (which should appear in October 2016). The first sign of it will appear in the accounts for the period to 31 December 2016 (which should appear in October 2017). These will contain 9 months rather than a full year of this new treatment giving rise to an additional corporation tax bill disclosed to us in October 2017 of 75% of £3.4m or £2.55m.

But that’s not all.

We also know – see my post of yesterday – that Facebook UK has approximately £10m of ‘deferred tax assets’ (effectively credits against future tax liabilities, and here comprised of carried forward losses and capital allowances). These would need to be depleted before any cash moves from Facebook UK to HMRC. £2.55m in the year ending 31 December 2016 would leave just about enough to clear the tax bills for the years ending 31 December 2017 and 31 December 2018. So the first cash changing hands in consequence of this deal would be in the year ending 31 December 2019 and we’d find out about it in October 2020.

Of course, this calculation makes a number of assumptions which may or may not be right. If Facebook’s UK revenues grow faster the deferred tax assets would be depleted earlier. Earlier depletion might also result from HMRC’s existing enquiries into Facebook UK’s affairs bearing tax fruit. Or the assumptions made in my calculations might just be off.

But, even bearing these in mind, the BBC’s Businesss Editor Kamal Ahmed’s blog post of yesterday which led with:

Facebook is set to pay millions of pounds more in tax in the UK after a major overhaul of its tax structure.

might look, in the cold light of day, a little excitable. “Set,” perhaps, but not for a good few years to come.


Facebook and UK Corporation Tax

This morning Facebook UK announced – via the BBC’s Kamal Ahmed – that it would start booking sales in the UK. Here’s what they told the BBC:

Capture

What this means in practice is that Facebook UK’s taxable UK profits will cease to be, as previously they were, a simple mark-up of staff costs (a fact I revealed here).

Instead they will be, in part at least, a function of the value that is generated in the UK by those staff. In principle this should mean higher taxable UK profits.

So, welcome news. But (and you knew I was going to say this) let’s not get carried away.

First of all, Facebook UK Limited appears from its accounts to have three activities in the UK:

Capture

being sales support; marketing services; and engineering support.

The “marketing services” and “engineering support” – which you might think of as maintaining the Facebook machine and developing new bits of it – activities will continue to generate UK taxable revenue only on the basis of what the staff cost plus a small mark-up. We should expect these bits to lead to materially no UK tax liability now or in the foreseeable future.

What about what was previously described as sales support? Facebook UK has two types of customer. Those who have UK client managers and those who don’t. It is only in respect of those who have UK client managers that a proportion of the value of those sales will fall within the UK tax net. Sales to those who don’t have UK client managers will continue to be taxed in the Ireland.

So what will now be taxed in the UK is the value added by a sub-set of a sub-set of Facebook UK’s staff.

Second, it’s important to note that, like Google, none of the profits that the Facebook Monolith – i.e. if you assume a world in which what is economically a single entity is taxed like a single entity – makes on UK sales will be subject to UK corporation tax. Unlike Google we can’t know precisely how big those UK sales are – but they are very likely to be billions. What is taxed instead is a combination of fragments of deemed profits on UK costs and deemed profits on deemed value added by a limited number of UK staff. You don’t need me to tell you this ain’t what a sensible corporation tax system looks like.

Third, Facebook has considerable reliefs available to carry forward. You can see that from here:

Capture

Previously Facebook UK didn’t bother to recognise these sums (effectively comprising rights to reduce future tax bills) as assets because they didn’t think they’d ever have any UK corporation tax liability to pay. This might now change – but regardless we should expect it to be a good while before today’s deal results in any real cash moving from Facebook UK to HMRC.

So although this morning’s announcement has been well handled in PR terms, it seems to me that it is unlikely to be especially meaningful in terms either of actual cash passing from Facebook or in terms of its tax liability. Facebook UK’s last published accounts disclosed a payment of £4,327. I wouldn’t bet on today’s announcement resulting in any meaningful change.

***

Another important and related aspect to note is that what Facebook UK have announced today is a forward looking change – effective only from April 2016.

Facebook UK Limited have refused to confirm or deny that they are under revenue enquiry for years up to now – but it’s clear from their accounts that they are.

Capture

Of course we can’t know that these claims relate to how they fragment their sales and engineering businesses to minimise their tax liability. But the Google experience suggests that it’s a pretty decent guess they do.

And nothing in today’s announcement deals with these enquiries. Nor the period after them, from April 2015 to April 2016, when the Coalition’s diverted profits tax applied.

But likely it won’t be until October 2016 at the earliest – when we see Facebook UK’s accounts to 31 December 2015 – that we gain any clarity about past years.

***

What, finally, about the Diverted Profits Tax?

I understand that, like Google, Facebook regards its tax planning as robust enough to withstand a Diverted Profits Tax challenge. But they do accept that it adds tax risk to their business model. And it is a combination of that added tax risk and a response to public perception of them as tax avoiders (despite HMRC’s hugely unhelpful Policy Statement of earlier this week) that is causing them to book at least some real profits in the UK.

This is a real credit to those who have been campaigning for tax justice – through our actions we can achieve  what Government is either unable or unwilling to.