On Sunday I wrote about how the tax system, examined as a whole, isn’t nearly as progressive as George Osborne suggests. It’s regressive, in fact.
I gave the Office for National Statistics numbers for ‘quintiles’ – the lowest to highest earning fifths – of households. But here’s a chart for deciles which makes the point even more strikingly.
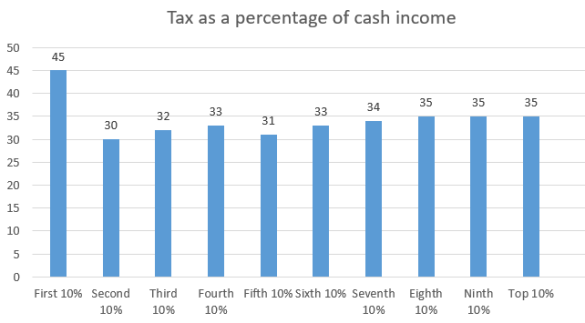
These are ONS numbers – taken from here – and they give tax as a percentage of the total of earned income and cash benefits.
The main culprit is Council Tax which – even after ‘Council tax support’ – consumes 9% of the total for the First 10% but only 1.5% of the income for the Top 10%. Every time – as with, for example, the Social Care Precept – Government chooses to fund spending through Council Tax you should be outraged. It is willfully choosing to dump those costs on the poorest because to do so is politically expedient. Collectively we understand but poorly the distributional effects of raising Council Tax. This enables Government to do what it should not without political cost.
But alongside the regressive nature of our tax system there is a related debate to be had about benefits.
Does it matter that the poor are disproportionately taxed if they disproportionately benefit from the benefits taxes fund? Is it the net effect of taxes paid and benefits received that one should analyse?
Of course, this is not what Osborne sought to do. The currency of political debate is ‘who bears the burden of taxation’. That political debate readily assumes, and often in ugly language (see this reference to “scroungers“), that the poor are beneficiaries of a burden borne by others.
But there is also a discrete, economic, debate.
This debate is also informed by ONS figures. Here are their absolute numbers for cash and other benefits in kind received directly from Government (see Table 14).
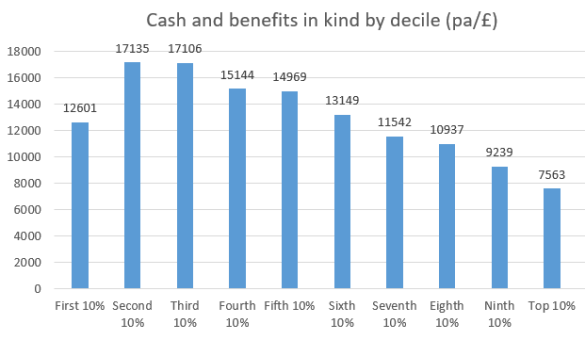
The explanation for these numbers lies, in particular, in the universality of the state pension; the fact that all deciles are substantial consumers of education and (in particular) the NHS; and the fact that the rail subsidy is disproportionately enjoyed by the rich.
Of course, looked at as a percentage of income rather than in absolute terms, the poorer deciles benefit more than this chart reveals. But in absolute terms the differences in the extent to which the deciles benefit directly from Government are far less profound than you may expect.
I use this phrase “directly from Government” quite deliberately. The ONS figures capture those benefits we receive directly. But they do not capture those benefits we receive indirectly. They do not capture the extent to which the wealthy benefit from the infrastructure that enables income to be generated and wealth to be protected.
If we analyse who are the big beneficiaries of that infrastructure – of the legal system that enables income to be generated and protects property rights, of the police and army that secure our wealth from confiscation by acquisitive forces, of all the complex systems that Government provides and sustains and which enable us to earn our incomes – it is self-evidently the wealthy and high earners who benefit most.
Is there some argument that requires that we have regard to the direct benefits our tax system funds – but that we ignore the indirect benefits? If there is, I do not see it.
Of course, we should all benefit – as economic agents and as moral beings – from the social compact to which we, willingly or unwillingly, subscribe. We are, as George Osborne observed in the quote with which I began this discussion, “in it together.” True, we benefit differently. But we must each contribute according to our means.
Follow @jolyonmaughamPostscript:
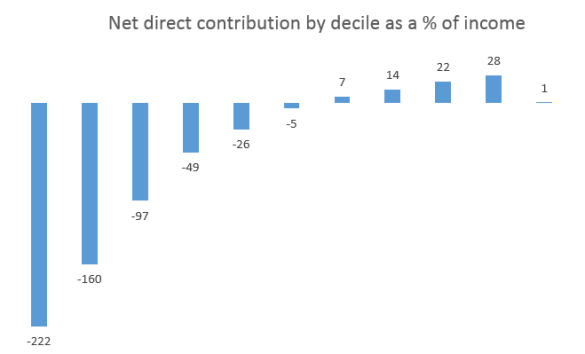
Here’s Andrew Jackson’s chart (see ‘Comments’below) of net direct contributions (I have re-titled his chart but the data is his).
Andrew adds:
“At first glance it looks very odd that the negative bars are so much bigger than the positive even though the total is 1%, but of course the negatives are percentages of much smaller numbers so this is to be expected.
“The other odd thing is that it comes down to only 1% difference, implying personal tax and benefits are largely breaking even; presumably other taxes cover all other spending. Although with council tax in there but local services excluded, that is also odd. In fact, the more you look at this the more you realise what is not included, at least in the way of benefits… but it’s a start.”

OK. Another one of my normal bad comment from me.
Your previous blog post was criticized by some for just looking at the tax position rather than by just looking at the net cash position. I thought about putting a comment in about that is just like a barrister saying that they had a 100% winning position in court by ignoring the losses but chose not to.
Your new post goes the other way and adds in the non-cash benefits. While these are important, it is the net cash position that is key when you are asking people to pay tax. A benefit that cannot be realised for cash cannot be used for tax. So including benefits in kind is a bit like a barrister saying that they win 90% of their appearances in court as they are very good at tennis. I
If you want to be fair, which you may not want to be, it would be interesting to add a graph showing the net cash position.
I also wonder about the use of “self-evidently” to justify a point. If someone has a high income and a high marginal rate of tax does that substantial amount of tax offset this infrastructure benefit? Also, I don’t see how this works if you take three people (well, technically, households) who work for the same organisation, live in the same part of town but do slightly different jobs so that they are in the second, third and fourth quintiles. How does the infrastructure benefits that you mention differ between them?
I’ve addressed the question whether the progressivity of the tax system is a matter of discrete interest. I’m not going to repeat myself. You then go on to come quite close to suggesting I’m deliberately misleading people. Repeat that suggestion and I will block you from further comment.
You then say I should ignore non-cash benefits. I disagree. They are what we directly receive from the system and are part of any rational in/out netting off equation.
Although it’s not especially relevant to anything because your predicate is flawed you’re just flat wrong to assert that if benefits can’t be realised for cash they’re not taxable.
When I said: “A benefit that cannot be realised for cash cannot be used for tax” it relates to using that benefit to pay that tax. So if I’m allowed access to the NHS for free I cannot use that to pay my council tax.
On your last point, I think we are talking at cross purposes. I’m not aware of any benefits in kind (as the ONS report that your previous blog linked to defines them) provided by the government that are taxable. I am aware that some benefits in kind provided to employees and the self-employed can be taxable.
As cash benefits are effectively negative tax, a very different picture emerges.
A few quick comments.
I mentioned the IFS view that people in the bottom decile might be there temporarily, so they spend high parts of their income and thus pay VAT out of proportion to those in the second and other deciles. The 45% figure may not be a life long burden but a shorter term consequence of absence from employment.
I’m not so sure on how well we measure and attribute the indirect benefits of the State. I suspect defence against foreign invasions was seen as beneficial to the life and liberty of all, not just the rich.
And if you consider the legal structure around defence of the person I suspect this applies as much to marginalised inner city areas as leafy suburbs, maybe even more.
There is also evidence the NHS disproportionately benefits poorer people. “Despite their shorter lives, poorer people make more use of NHS services – especially emergency services”
( https://www.york.ac.uk/che/news/2016/health-inequality/)
These are clearly areas for further research. But I still think the overall impact of taxes and benefits remains progressive. As the ONS said, the pre tax ratio of income before tax and benefits is 15:1 for the upper to lowest quintile; after tax and benefits it reduces to 4:1.
I notice that your charts show the effective tax rate as a percentage, but the cash and benefits in kind as absolute numbers, which makes it hard to see how they interact.
As an exercise, I have quickly taken the same numbers as you and come up with a graph of the effective rate at which the deciles contribute to Government, calculated as:
((direct tax + indirect tax) – (cash benefits + benefits in kind)) / (earnings + other private income)
That is, treating benefits as negative tax.
I can’t see how to add an image here, but this gives a smooth curve from -222% for the first decile to +28% for the tenth, crossing the x-axis between the 6th and 7th deciles.
It would seem to suggest that if indirect benefits are omitted, then the overall impact on individuals is progressive, with the rate of progressiveness declining as you move up the deciles (or increasing as you move down, depending on how you care to look at it).
I’m not sure whether this affects your conclusions either way, but I though it might be interesting for purposes of discussion.
If you email it to me I can, I think, add it as an addition to your comment.
The second part of this piece comes close to being a circular argument: if you define the benefits of the state as the prevention of confiscation and the provision of an environment in which we can earn money, then of course those who have and earn the most benefit the most. But this just invites a still broader argument about the kind of environment that allows the creation of wealth, without which there is nothing to redistribute in the first place. A major advantage of living in a modern capitalist economy (as compared to most of the alternatives) is not starving to death, which is a very progressively distributed benefit.
However that’s an argument for another time, and it is already abundantly clear from your graph that the system taken as a whole is indeed progressive. You could make this even clearer with a graph showing the difference between original and final income: by this measure the average second decile* household is a net recipient (all benefits minus all taxes) of £11,654 (supplementing original income of £7,304) while the equivalent top decile household is a net *contributor* of £28,684 (reducing original income of £102,366).
However the important question here is whether the system is more or less progressive than we want it to be, and whether the current direction of travel (more regressive) is justified. I don’t think this debate is helped by arguing that the system is regressive when it very clearly isn’t, and neither do I think that this is necessary: when the top decile of earners get to keep on average 72% of their earnings it’s far from obvious to me that the pips are squeaking.
One final, completely unrelated point: it’s interesting to look at the split in the ONS data between retired and non-retired households. It’s quite hard to square the picture that emerges with the tale of rich pensioners and intergenerational strife we keep reading about.
*not an attempt to cherry pick, honest: the bottom decile in these stats looks odd to me: a group that earns far less but also receives far less in benefits, contrary to the pattern in other deciles. I guess people living off their savings temporarily would skew the picture somewhat: I don’t know.
As always interesting discussion. If I may, a slight digression on distributive effects of Council tax and taxation of property in general. Given that property is the dominant luxury good, in the economists’ sense of one on which spending rises faster than income, taxation of it could be a significant way in which indirect taxation is progressive – unlike almost any other indirect tax, however worthy, such as on alcohol, sugar or just normal VAT. That Council tax is actually regressive is quite a tribute to the dysfunction of our tax system.
I do accept the need to look at benefits along with tax, but it raises the question of where you stop – there are any number of other ‘distributive’ policy areas. Wrt again to property, the failure to increase housing supply is the big one here – see Matthew Rognlie’s analysis of Piketty, artificially boosting returns to existing property owners, and in particular aggravating intergenerational inequalities.
Maybe the matter for a separate blog?
Wrt the original post, I don’t agree that “it is self-evidently the wealthy and high earners who benefit most [from public goods and infrastructure].” Maybe if quantified in absolute monetary terms, but otherwise not.
To be clear, I haven’t argued that a ‘system’ of cash earned plus cash benefits plus benefits in kind less taxes paid produces a regressive result. I have argued that that is a narrow definition of a ‘system’ and that a broader definition of ‘system’ would produce a less regressive or progressive result. I don’t think that’s a ‘circular’ argument: I clearly benefit more from a system that creates demand for my skills than I would without such a system. And that is likely to be true of almost everyone with a very high income or wealth.
Well when you ignore benefits and say the tax system is regressive, I think you create a misleading impression (not deliberately, I hasten to add before you block me). But let’s not have that argument again.
I quite deliberately said ‘close to’ circular, by which I suppose I meant ‘ circular in parts’: it’s a question of emphasis. Those aspects of the system that protect property, for instance, are obviously going to give greater monetary benefit to those who own more property. But not everything can be measured in monetary terms (is losing my home worse for me if mine cost more than yours?) and many aspects of the ‘system’ benefit everyone equally: not getting assaulted, being able to see where you’re going in the street at night, and so on.
I don’t think I have an email address for you – unless you’re happy for me to use your address at your chambers, of course.
that’s fine.
interesting stuff – I just want to register my surprise about council tax (genuinely, not weasel words for I think this is wrong) – I’d have guessed that being in the bottom decile would have qualified you for close to 100% relief on that. As you say, distributional consequences not well understood.
Good to see that postscript with Andrew’s data for net benefits as % of income. Another way to present much the same data would be to plot take after tax, net of benefit income against income (rather than income decile). Fit a linear regression to this, and from the slope and intercept, you can read off the flat tax rate and minimum citizen income level which our tax system most closely approximates. I once did this with a very small data set, the the fit was pretty good.
I don’t mean this as an argument for a flat tax system, but I find the exercise at the least thought provoking.
That graph resembles a saw-tooth, not one of regression which would be a left to right slope downwards.
The spike for the lowest decile needs explaining. The most incapable of financial management which coincides with the poorest have their Housing Benefit paid direct to their landlord ( usually a social landlord ) and so this doesn’t appear as a cash benefit. The next decile up who are also poor but essentially capable of responsible financial behaviour will typically have Housing Benefit paid directly to them, so this appears as a cash benefit, and then pay rent to the Landlord from their additional cash income which will likely be half as much again as decile 1. Generalising of course, but not by much, but it destroys the claim of regression.
The council tax issue is valid though. Equality impact assessments of changes to discounts appear on council web-sites. One west London borough reveals 12,000 court summons for non-payment for 100,000 residential addresses each year, but the ratio is about 1:5 for households in receipt of Support, and less than 1:12 for households that are not. That 1:5 ratio would be worse if taking out those with nil liability ( e.g. protected groups such as people on Pension Credit ). Making council tax incident on the property owner would save a lot of administrative hassle, as well as address the regressive aspect.
I just love, Andrew, how first-timers swan in and tell me I’m stupid without bothering to do the most basic of research such as, for example, checking the figures I took the trouble to link to. If you did click through on the link you would have seen that the ONS includes (and so I have included) housing benefit as a cash receipt for those in the first decile. I’m afraid you’ll just have to take it on trust that I know what regressive (or “regression” as you call it) taxation looks like.
Kind of a pity we got off on the wrong foot because your Council tax summons point – I am so pleased you concede that in my blundering stupidity I managed to get at least something right – is interesting evidence of that which is obviously right (and complements this point https://twitter.com/joeAlane/status/714741200608165888 made earlier today).
Apologies – I have done more checking and you’re right on the Housing Benefit paid via LL and direct to tenant being treated the same for cash benefit purposes. The reason for the spike in taxation in decile one can be inferred from Table 14 and it’s different from what I said. The reason has also not been mentioned by you either (that’s a tease!). Apologies all the same.
What do you take the reason to be, Andrew? The level of indirect taxes compared to income suggests to me a proportion of this group living off savings (i.e. not earning or receiving benefits, but still spending and therefore incurring VAT and duties).
As I noted on the post about tax the IFS comments in a recent study
Click to access 09chap10.pdf
The IFS says that “many people in the lowest income decile will be temporarily not in paid work and able to maintain relatively high spending in the short period they are out of the labour market. Because their spending is higher than their current income, these people will be paying a high fraction of their current income in VAT. Similarly, those with
high current incomes tend to have high saving, and so appear to escape the tax, but they will face it when they come to spend the accumulated savings