I’ve banged on about tax expenditure reliefs already. Twice, in fact: here and here.
I made a few points in those posts. We know tax expenditures are hugely expensive. They cost us – through tax revenues we don’t collect – more than £100bn every year. But no one knows quite how much they cost us because Government doesn’t collect the data. And no one knows either whether we get value for money from them because… Government doesn’t ask.
So in governance terms they’re – there’s no putting lipstick on this pig – a disgrace.
I also asked why this state of affairs persists?
Why is Osborne’s Spending Review focusing solely on cutting £20bn from already lean departmental budgets but doing nothing to trim the fat from the revenue side of our profit and loss? Why does he – quite literally – not want to know about the public costs and private benefits of tax expenditures?
What I want to focus on here is a few points about who benefits from tax expenditures. And I’m going to look at income tax expenditures.
There’s no published data – or at least none that I’m aware of – on this. That tells a story all of its own. But I think I’ve been able to reverse engineer some. So as not to clog up the narrative, I’ve set out in detail how I’ve done the calculations at the bottom. Do have a look: if I’ve got them wrong, obviously I’ll hold my hand up.
It is possible to extrapolate from Table 2.5 (with a little help from 2.6) for 2015-16 here something of how the benefit of tax expenditures is spread amongst income tax payers.
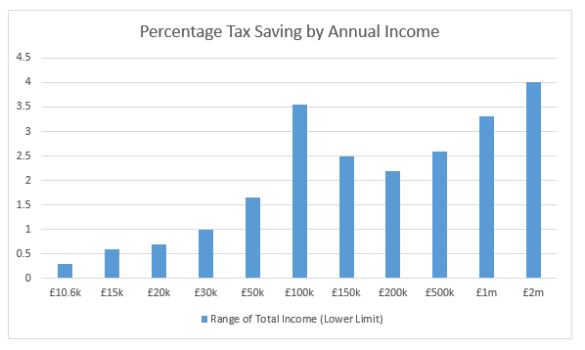
This first chart below tells you how much the average income tax payer in certain income brackets has their tax bill cut by (some) income tax expenditures.
The “(some)” is because as I set out at the bottom of this page the data only enables me to infer the distribution of a subset (about £13.5bn of more than £32bn of so-called ‘principal‘) of income tax expenditures. 
As you can see, if you earn more than £2m per annum (and the average taxpayer in this earnings bracket earns £4.76m per annum) you benefit (from income tax expenditures alone) to the tune of on average more than £190,000 per annum. But if your income is between £30,000 and £50,000, for example, they benefit you £382 per annum.
It is worth noting that the distribution of the remaining so-called principal income tax expenditures follows the distribution inferred here then you would increase those numbers by 240%. So the average income taxpayer in the £2m plus bracket would derive over £450,000 per year from income tax expenditures.
My second table shows that these tax expenditures do not only benefit high earners more in absolute terms. They also benefit high earners more in percentage terms. Put bluntly, they are regressive. This is exactly as you would expect: those paying higher rates of tax are more incentivised to seek out income tax reliefs. And those earning more are better able to engage in the sorts of activity that attract tax reliefs.
The third table shows you how the benefit of these inferred income tax expenditures is shared amongst some taxpayers.
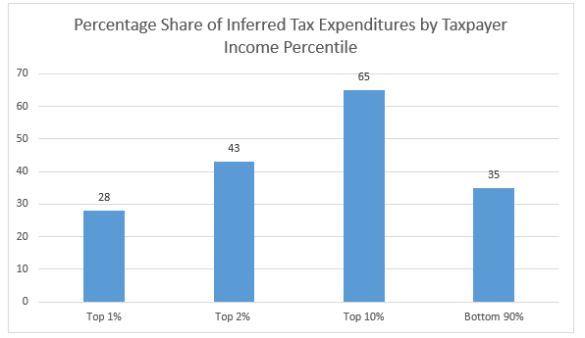
As you can see the top 2% of income tax payers (which is broadly the top 1% of earners – because only just over half of over 16s earn enough to pay income tax) receive 43% of all inferred income tax expenditures. And the top 10% of income tax payers (the top 5% of all earners) receive 65% of all inferred income tax expenditures.
Startling though these results are, there is good reason to think them conservative. The (rather puzzling): “Allowances given as tax reductions” line in Table 2.6 here shows 70% of those “allowances given as tax reductions” going to the highest earning 1% of income tax payers.
The Calculations
Table 2.5 sets out for each of the earnings brackets (a) the number of taxpayers in that bracket, (b) the total income of those taxpayers, and (c) the total tax paid by those taxpayers. From (a), (b) and (c) you can calculate (and Table 2.5 does) the average rate of tax paid by those taxpayers.
For any individual taxpayer in that bracket you could identify what tax she would have paid after her personal allowance but before any other reliefs. Tax practitioners call this the ‘blended rate’ (it’s ‘blended’ from the personal allowance, basic, rate, higher rate and additional rate).
Of course we don’t have an individual taxpayer. But if we take (a) and (b) for each of those brackets we can construct what the average individual in that bracket would earn. I have taken that average individual and worked out her ‘blended rate’.
If you deduct the average rate from the blended rate you get a percentage which is accounted for by, I believe, certain types of tax expenditures.
You also need to take into account that not all income is taxed at the same rate. In particular, dividends are taxed at 10%, 32.5% and 37.5% rather than 20%, 40% and 45%. Pro-rated by number, this effect isn’t particularly material for basic rate taxpayers so I’ve ignored it for them. This will mean that the amount of tax reliefs inferred for basic rate taxpayers is overstated.
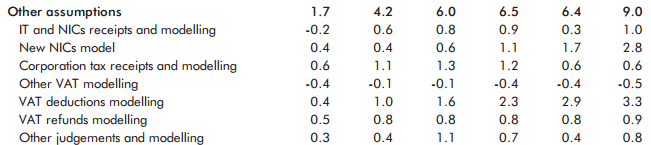
But for higher rate taxpayers, tax on dividends amounts to 10% of all the tax they pay. And for additional rate taxpayers it amounts to more than 14% of all the tax they pay (you can see this from Table 2.6 for 2015-16). By my calculations this difference will typically account for about 1% of the difference between the blended rate and the average rate for additional rate payers. And 0.75% of the difference for higher rate payers.
So I have deducted this (1%, 0.75%, or 0%) from the difference between the blended percentage rate and the average percentage rate.
If you then apply the resultant percentage to the gross income of that average individual in each tax bracket you can infer a tax reduction which is ‘unexplained’ by other means and which, it seems to me, must be attributed entirely (or virtually entirely) to tax expenditures.
Let me illustrate the calculation.
There are 5,000 taxpayers earning more than £2,000,000 per annum. They earn aggregate income of £23.8 bn. And they pay aggregate tax of £9.43bn. This gives an average rate of tax of 39.7%. The average taxpayer in that bracket has income of £4.76m per annum. Pre-reliefs, that taxpayer would pay income tax of £2,128,143 (a blended rate of 44.7%). 44.7% – 1% (dividend effect) – 39.7% = 4%. 4% of £4,760,000 = £190,400.
If you multiply £190,400 by 5,000 taxpayers you get the aggregate inferred tax expenditures enjoyed by taxpayers with income of more than £4.76m (or £952m). If you do that exercise for every income category you can then work out the figures in my third table. The taxpayer income percentiles come from here. They are from 2012-13 but the difference will be, in the scheme of things, modest.
The aggregate inferred income tax expenditures is about £13.5bn. By way of comparison the sum of the ‘principal‘ income tax reliefs for 2014/15 is something over £42bn.
For comparison, my results are more conservative than those produced by the (rather puzzling) “Allowances given as tax reductions” line in Table 2.6 here.
However, I can see no reason why the unaccounted for income tax expenditures should follow different distribution curves to those set out above. Indeed the (rather puzzling) “Allowances given as tax reductions” line in Table 2.6 here suggests that my analysis is conservative. It shows 70% of “allowances given as tax reductions” going to the top 1% of income tax payers.


You must be logged in to post a comment.