This is the Leave vote for England and Wales (by constituency and political party)
And this is the Remain vote

If you click here you’ll be taken to an interactive and enlarged version of these maps. Click on your constituency and you’ll see its Estimated (and if available Actual) Remain and Leave Votes; a sense check against another similar exercise (this carried out by Chris Hanretty); and the 2015 General Election results for your constituency.
The Leave/Remain data was not, or not often, collected by constituency and so you’ll need an explanation of how these maps were constructed. Click here for that explanation (by the brilliant @ZackKorman). He also explains why the map does not extend to Northern Ireland and Scotland.
Especially interesting are these tables which show, for England and Wales, how many constituencies of each political party voted Remain and Leave and how many constituencies of each runner up political party voted remain and leave. 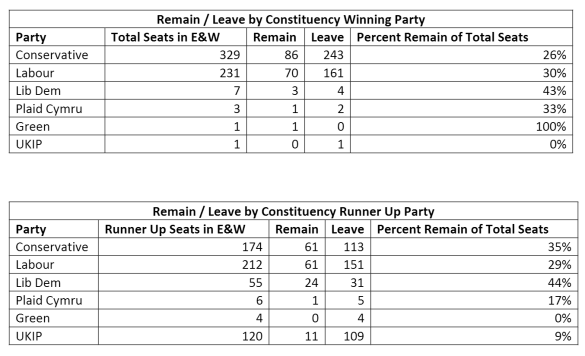 I’m not going to do the editorialising. I’ll leave that to others.
Enormous thanks to Zachary Korman who you should certainly follow on twitter: Follow @ZackKorman.
Jolyon Maugham QC

You must be logged in to post a comment.