Some facts about Fixed Odds Betting Terminals

Here are some facts about Fixed Odds Betting Terminals.

For bookmakers they “are one of the most profitable forms of high street gambling” (see paragraph 1.190 here). In September 2014 there were 35,059 such machines (see Table 2) generating an average revenue per machine (amounts staked minus prizes) of £46,315 (see Tables 2 and 3).

They are known to be used by drug dealers to launder money, an issue that Government recognises.

A 2005 report by Europe Economics for the Association of British Bookmakers showed that a bookmakers’ gross margin on FOBTs was 2-3% (see paragraph 1.2.4 here), a figure consistent with March 2012 data published by the Guardian (showing a return of 97%). Taken together with the average revenue per machine, this implies an average of over £1.5m per annum is wagered on each machine. Of course, criminals have to pay people to feed this money through machines but they still look (to this uneducated eye) a cheap way to launder money.

The statutory regulator, the Gambling Commission, has recognised that, of those who use machines in bookmakers, 50% show characteristics which might indicate that they might be a group at risk of harm (paragraph 9.11 here). And machine gambling in bookmakers and problem gambling in bookmakers are correlated with low income (see paragraph 9.9 and 9.15 here).

We also know that Licensed Betting Offices (or LBOs) are clustered in areas of high deprivation:

Capture

And in areas of high unemployment:

Capture

(both of these charts from this report by the Responsible Gambling Trust which works closely with the Gambling Commission). And that substantially all revenue generated by FOBTs is generated in bookmakers (£1.613bn of £1.623bn see Tables 3 and 8 here).

Government benefits too, and through it so do we. Gambling duty applies at a rate of 25% to that revenue (totalling in September 2014, £1.623bn – see Table 3 here) to generate a yield of some £400m.

And that leaves net revenue for bookmakers (after machine games duty) of a little over £1.2bn.

So let’s sum up.

Bookmakers gain £1.2bn. Government gains £400m. Those revenues come (in unknown part) from money launderers. They also come from gamblers, 50% of whom show characteristics which might indicate they are at risk of harm. And the poor are disproportionately represented amongst those gamblers, a factor that bookmakers take into account in siting their shops.

I should also recognise that bookmakers say that these gambling winnings support employment and so deliver employment taxes.

All Government is about making choices. We make these choices when we decide how hard to clamp down on the money laundering which primes the UK property market bearing in mind that the structures favoured by money launderers deliver unexpectedly high revenues to Government. We make these choices when the College of Policing decides that an answer to the question how “to deliver policing in an age of austerity” is to accept revenues from the Saudis. We make these choices when we decides how aggressively we want to pursue the low rates of corporation tax that have been described by one academic (reasonably, in my view) as an attempt “to become a tax haven” – but which are expected (reasonably, in my view) to deliver increases in the size of the UK tax base.

I don’t want to stand on a high horse and pretend these choices are easy. But an equation that delivers modest (in exchequer terms) amounts of revenue to the Government, substantial amounts to bookmakers, where that revenue is drawn disproportionately from the pockets of the poor and the unemployed, and which facilitates money laundering, doesn’t look like a good choice to me.

Some brief thoughts on Facebook’s accounts

Facebook UK Limited – which I’ll call UK Facebook – has published its accounts for the year ending 31 December 2014. Heather Stewart of the Guardian has written about them here. I wanted to add a few points of my own.

First of all, don’t be fooled into believing that these accounts tell you anything about what advertising revenue or profit Facebook makes from UK based advertisers, or advertising targeted at UK consumers. UK Facebook’s business is this:

Capture

So its business is providing services to what I’ll call Real Facebook.

Second, UK Facebook could have chosen to tell us a little more about the transactions it enters into with Real Facebook. But, as is its right, it didn’t:

Capture

I don’t suggest there’s anything legally wrong in it having declined to disclose this material. But it seems – to me at least – a strange decision for a company whose tax affairs are very much in the public eye. It could have taken the view that its reputation would be better served by transparency – but it didn’t. And people are bound to ask the question, ‘why?’

Third, its accounts show a more than doubling of turnover from 2013 to 2014:

Capture

Most businesses’ profitability improves when they double their turnover. But not UK Facebook’s: its pre-tax loss actually increased from 23% of turnover in 2013 to 27% of turnover in 2014. That’s not a feature most people would expect to see in a rapidly growing normal business.

Fourth, another notable feature of UK Facebook’s accounts is its huge staff costs:

Capture

These are obviously substantial: as a proportion of turnover they were 82% in 2014. But, perhaps even more remarkably, they are static as a proportion of turnover: in 2013 they were also, yep, 82%. Again, that’s not a feature most people would expect to see in a rapidly growing normal business. You’d expect staff costs as a proportion of revenues to decline as a business increases in size.

Now, the most likely explanation for this is that UK Facebook charges its services – largely consisting of its employees – out to Real Facebook on a cost plus basis. I’m not suggesting that there’s anything unlawful about this. But it does rather imply that UK Facebook may well never make a profit. Because what are described in its accounts as its revenues are really just its staff costs multiplied by a number (here 1.22). And that extra 0.22 may well never be enough to cover office costs, fixed assets and so on.

Certainly that 82% (or 1.22 multiplier) ratio suggests that the UK taxpayer won’t ever enjoy meaningful profits from whatever success Real Facebook enjoys in the UK.

Indeed, that seems to be UK Facebook’s own view. Its accounts set out how it treats its deferred tax assets (basically, the right to set past losses against future profits) and states:

Capture

And does UK Facebook recognise deferred tax assets?

Capture

It does not.

Finally, Heather’s article is attracting some criticism from the twitter intelligentisa for failing to recognise that, by paying remuneration in the UK, UK Facebook is actually increasing its UK tax liability. That criticism seems to me to be misplaced for a number of reasons.

  • Even if you assume that all of the remuneration it pays in the UK is paid to UK resident employees, the net effect of doing so is that its employees acquire an income tax (and modest NICs) liability. And UK Facebook acquires a liability to pay Employer’s National Insurance Contributions of 13.8%. That rate is lower than the rate of corporation tax (likely to be 21% depending on timing) on profits diminished by the payments to employees.
  • You want to be careful not automatically to assume that, because the staff are employed by UK Facebook, it follows that they pay tax on their employment income in the UK. For example, if UK Facebook engages staff who are resident in the US, it is the US, not the UK, that has main taxing rights in respect of the income of those staff. So UK Facebook could be depleting its profits chargeable to UK corporation tax by paying salaries to staff resident elsewhere on which salaries no UK income tax liability accrues and which still deplete the corporation tax liability of UK Facebook.
  • Moreover, the average staff member enjoys a remuneration package with an average cost to Facebook of £238,000.  No one pays their staff that unless there’s pretty vigorous competition for the services of those staff. It’s at the very least very possible that, if Facebook wasn’t paying them here, someone else would be.

In any event, clearly, it’s no defence for X, facing an allegation that it doesn’t pay the appropriate amount of corporation tax, to say: ‘well, I’ve done some other things that the law requires of me.’


Can we simplify the tax system?

The UK’s tax code – in 2015-16, because next year it will be longer – runs to 22,298 single spaced, small font, heavily footnoted pages. That’s two-thirds the page-count of the 32 volume Encyclopaedia Britannica, which affected to summarise the sum total of human knowledge.

The immediate consequences of this state of affairs are uniformly negative. Complexity clogs the ability of business to grow; reliefs, poorly attuned to the behaviour they’d like to incentivise, distort the decision-making of consumers and businesses alike; new technologies enable arbitrages that reward fiscal and punish commercial efficiency; and enormous compliance costs barnacle the journey to profit.

We have an Office for Tax Simplification. Setting it up, the Coalition delivered on a 2010 Conservative Manifesto Pledge, one which grew out of a Geoffrey Howe chaired report entitled ‘Making Taxes Simpler’. That report took “as its starting point (and rightly so) the proposition that the UK direct tax system cries out for simplification and reduction in scale.” Its main recommendation was the establishment of an Office for Tax Simplification.

But in each and every one of the five years the Office for Tax Simplification has existed the tax code has grown by an average of 900 pages.

How did we get here? And is there any room for optimism?

In April this year, Andrew Tyrie MP, Chair of the Treasury Select Committee, called a meeting with a small group of hand-picked leaders from the tax field – academics, lawyers and accountants – to discuss proposals to improve the functioning of the Office for Tax Simplification.

The tax profession is pretty uniform in its desire for progress – whatever you might read elsewhere – and suggestions weren’t slow to come.

But they foundered on a single, political, reality.

Achieving tax simplification isn’t a technocratic exercise. It creates winners and losers. And losers make a lot of noise – remember the so-called Granny Tax? A simplification measure to freeze the personal allowances of over 65s and over 75s until the rest of us caught up – and the choice of who they are is an intensely political one. And those political choices will often fail to coincide with what, in purely abstract terms, good tax policy looks like.

Indeed there are occasions when it will stand in direct opposition to it. A good recent example of this is the Google Tax.

Business hated it: it tore up the Coalition’s Corporate Tax Roadmap. The tax profession was no more enthusiastic: the ACCA, ICAEW, CIOT and others lined up to slam it as radical, introduced without proper consultation and pre-empting international measures to tackle avoidance. All in order to raise washers. Nevertheless, and unopposed by Labour, it became law.

It was dictated by politics. The (unfounded) vulnerability of the Coalition to allegations it was soft on tax avoidance rendered the Google Tax politically necessary. And no appeal to process, or simplification, or anything else would persuade the then Government otherwise.

Understand this and you’ll understand that meaningful tax simplification involves the exercise of real political will. As Andrew Tyrie but few of his attendees recognised, politicians won’t delegate their most powerful mode of electoral patronage to an unelected technocracy. And nor, you might think, should they. And the abstract advantages of good tax policy aren’t, on their own, sufficient to cause politicians to act.

So what, then, is left?

There will be occasions when political and technocractic aims are coincident. And when those occasions arise we can expect a rationalisation of our tax system – but we shouldn’t kid ourselves that the driver is a technocratic one. We can hope for, indeed expect – for there is an uncertain but steady drift in this direction – a process that produces better quality legislation. But I don’t see substantial reductions in page numbers in our future.

Perhaps we are better off working with this?

We live in a complex world. The modes through which we transact collectively multiply. The competition between businesses for a competitive edge takes in the attractant force of lower effective tax rates on the pricing of capital. Human nature is that we’d prefer that tax liabilities slipped from our roofs and onto those of our neighbours. And our Government jockeys with its neighbour and competitor nations for a greater share of the tax base. Perhaps the tax code we have is what the world we have demands?

But I will offer this prescription.

The overwhelming majority of taxpayers – individuals and businesses alike – don’t need the complex tax framework I’ve described. What they need is something which is rational, workable, and knowable. Perhaps that’s where the Office for Tax Simplification should focus its attention. Maybe the simplification of our tax system looks like its division into two tax systems: a short one for taxpayers who eschew and a longer one for taxpayers who embrace complexity?

Oops. I can’t believe he did it again.

In a speech this morning from the new Shadow Chancellor which was rather longer on rhetoric than concrete policy, one measure stood out.

True, it stood out was because it was the only concrete policy announced. But it also stood out for its wrongheadedness.

McDonnell called for this:

Capture

But in the Summer Budget, the Conservatives had already promised to introduce exactly this measure:

Capture

What certainly is different is the proposed yield. The Conservatives predicted a steady state yield from their proposals of about £170m per annum.

Capture

John McDonnell seems to be promising a yield of up to a staggering 7,600% of this. Indeed, as David Pegg of the Guardian has pointed out, the expenses claimed (in 2012/13) by individuals for property repairs, maintenance and renewals was just over £3bn – and the value of the ‘tax breaks’ on those expenses is a maximum of 50% (the then top rate of income tax) of that, or £1.5bn. On any view £13bn is fantasy forecasting.

The list of Labour’s tax bloopers since the General Election defeat is already a long one.

The mathematically impossible £5bn of yield from a 50% rate; the promised £120bn receipts from tackling tax evasion and avoidance (now downgraded, according to McDonnell on Today, to an equally illusory £20-25bn); £93bn of savings from tackling corporate welfare (now downgraded to unspecified “cuts“); and the shambles around Labour’s position on cutting the rate of corporation tax (where, in a single day, McDonnell called on Question Time for the Tories’ cuts to be reversed whilst in Parliament, Labour supported them).

But even with such worthy competition, this measure really stands out.

Note:

Michael in the comments section following has pointed out that McDonnell can be read as promising savings of less than £13bn. In other words, that he’s again (c.f. the £120bn tax gap and £93bn corporate welfare) performing a kind of fiscal dance of the seven veils – tempting his audience with the suggestion of a yield greater than that he knows is possible. This reading would not, however, explain why McDonnell mentions the £13bn figure if what he means is something closer to HM Treasury’s £170m estimate, or how £13bn hugely overestimates the scale of possible savings given the cost of the relief.

De-celerated Payment Notices

Earlier this week, HMRC issued a Press Release trumpeting its performance under the Accelerated Payment Notices regime introduced by the Finance Act 2014.

Capture

What APNs do is enable HMRC to require taxpayers who have engaged in certain types of behaviour – behaviour that has hallmarks of ‘bad’ tax avoidance – to cough up the tax they say they’ve saved by that behaviour whilst the courts decide whether they’ve actually saved it. From a tax collection perspective, they’re rather a good thing – for reasons I set out here – and were a key part of the radical panoply of measures introduced by the Coalition to tackle tax avoidance.

From a tax collection perspective. But nothing’s ever quite as it seems.

Because another great advantage of APNs was a political one. They brought forward taxes that Government thought it was going to receive anyway. But the wacky way in which Government accounting works meant that the receipts from them could be treated as new income. The best way to think of APN receipts is like the one-off cash flow boost a business gets by factoring its receivables for the first time. Nothing wrong with a cash flow boost – but Government accounting means that one-off boost is treated like ongoing income and can be used to support additional year-on-year spending, or help spin a narrative that Government was reducing the deficit, or enable Government to pretend to have been tougher on public spending than it really has been. Remarkably, in Government accounting terms you can get a P&L boost just by fiddling around with items on your balance sheet. I wrote about this trick here and here (forgive the title of that latter piece – I got a bit over-excited before the last General Election). And we’re talking about big numbers: this, and the other iterations of this trick, added up to over £10bn per annum.

Anyway. Back to the Press Release. It’s a marvellous round number, £1bn. But how does it compare with what Government predicted it would collect? The forecast revenues can be seen here (at page 22), here (at page 57) and here (at page 33). We’re a a little over 5 months through the tax year 2015-16 and so we should have received all the revenues from 2014-15 (£425m) plus 5/12ths of those from 2015-16 (£2,102m x 5/12) or £1,300m – 30% more than the £1bn actually received. Put a mute on that trumpet, HMRC.

More worryingly still, from Government’s perspective, is that this money is only contingent and – as I pointed out in a piece called ‘Our Big Tax Gamble’ here – there’s a decent chance that the contingency will come home to roost and Government will have to give it all back. When I wrote ‘Our Big Tax Gamble’, the possibility was a theoretical contingency. But it’s a little more than that now: the Supreme Court has just said it will hear substantive arguments in the biggest case of them all: the so-called Eclipse Film Partners case. It wouldn’t do that unless it was interested in those arguments.

If the Government loses in Eclipse it won’t just have to give back some of that £1bn – it will also have to relinquish future anticipated tax receipts of a multiple of that sum.

[Note: I am lead Counsel in Eclipse].

[Note: I am grateful to @strongerinnos and iamconsistent (see comments below) for pointing out what I shall – to save my blushes – describe as ‘improvements’ to my maths.]

Fiscal black socks

As I learnt last night on twitter, Jeremy Corbyn has an appeal that stretches across the political spectrum. He appeals to many on the left as a leader of the Labour Party because so few leaders before him have been ready to speak the truth without fear of the consequences. And he appeals to many Conservatives as a leader of the Labour Party for the very same reason.

Now, if Corbyn is to kick off of the clogs of convention across all areas of policy what will he reveal in mine? Of this there should be little doubt: the black socks of a wealth tax.

Capture

Wealth taxes have a powerful appeal to tax reformers on both the right and left. Income taxes place all of the burden on productive strivers and privilege those who hold fallow wealth. They moderate income inequality but leave untouched disparities in wealth. They permit inequalities to ossify over generations. Wealth taxes offer solutions.

The problem with wealth taxes is that they are really difficult to execute. Labour’s election manifesto in 1974 provided

REDISTRIBUTE INCOME AND WEALTH. We shall introduce an annual Wealth Tax on the rich; bring in a new tax on major transfers of personal wealth; heavily tax speculation in property – including a new tax on property companies; and seek to eliminate tax dodging across the whole field.

(I enjoyed that last bit: the same pledge could be found in the 2015 Manifestos of all the major political parties). But as Denis Healey noted in his memoirs

Another lesson was that you should never commit yourself in Opposition to new taxes unless you have a very good idea how they will operate in practice. We had committed ourselves to a Wealth Tax: but in five years I found it impossible to draft one which would yield enough revenue to be worth the administrative cost and political hassle.

But let’s not focus on the problems. To do so would be to misjudge the mood. Today at least. Let me instead focus on the prize: if it is worth having we might then turn then to ask whether the problems are worth tackling.

We are not blessed with high quality wealth data in the UK but this may not matter for present purposes.

Data in the World Wealth Report 2015 produced by Capgemini and RBC suggests there are 550,000 individuals in the UK with wealth of above $1m owning an aggregate of $2 trillion – or about £1.3 trillion. According to the ONS, aggregate net UK household financial wealth in 2010/12 was (coincidentally also) about £1.3 trillion. But this figure excludes non-financial assets such as houses. Update it and include all household wealth and you instead have a figure of £9 trillion.

Which of these – or other – data sets you focus on rather depends on what you are trying to accomplish. But what interests me is how you might raise a meaningful amount of money from wealth taxes – and in a way that is politically palatable or even attractive to the electorate. This looks to me like a cut in income taxes funded by an increase in wealth taxes.

For these purposes, the Capgemini number works as well as any.

If you charged a 2.5% annual charge on aggregate wealth of £1.3tn your theoretical yield is £32.5bn per annum. That’s a little more than what you’d need to fund a top rate of income tax of 30% kicking in at the present higher rate threshold (my calculations from table 2.5 (2015-16) here). A charge of 5% would fund a top rate of income tax of 20% with a surplus of around £5bn –  enough to mitigate the effects of many of the Conservatives’ welfare cuts in this term.

How might the electorate like those socks?

Laffer Curve: an elegant, useless idea

We talk a lot about taxing the rich – and perhaps we should. The rich become rich by operating in a system that the state enables. And the contention that taxation amounts to a deprivation of their money

is internally inconsistent. The rules of the game at which the rich win include a price to play. I cannot opt to abide by the rules that benefit me – but not the rules that don’t. No one forces me to accept the offer of my neighbour on the left to give him half the plums I collect from his tree. But if I do the half he gets were never my plums.

But this ineluctable logic can’t be pushed too far. Not if my neighbour on the right also has a plum tree – and he’ll let me keep 60% of the plums I harvest. Not if I decide that if I only get to keep half it’s not worth collecting the plums at all. And not if I took the view that, if I vault the fence in the dead of night, I might get to keep all the plums.

These ideas – and others – are all expressed in a relationship we call the Laffer Curve. We call it that wrongly, and uselessly too. Wrongly, because there is no one Laffer Curve. And uselessly, because no one knows what it looks like.

Here’s a Laffer Curve for income tax.

Capture

What it shows is (1) that if you have a tax rate of zero, you don’t yield anything. Few would argue with that. And (2) if you have a tax rate of 100% you also don’t yield anything because no one works and so no one pays tax. That’s slightly more tendentious: there’s always someone who so loves his job that he would carry on even if everything he earned went to the state. But let’s press on with the argument – leave Tax QCs to one side for the moment – and assume that at tax rates of 100% no one would work.

The logical consequence of these two propositions is that there is a rate more than 0% and less than 100% at which the tax yield is the highest – what we call the ‘revenue maximising’ point. Set tax rates too low and Government relinquishes more plums than it must. Set it too high and your taxpayers may defect to your neighbour, not bother at all, or be heavily incentivised to find ways to dodge your plum tax.

This is a basic – but incredibly important – insight.

It explains why there is a point beyond which raising taxes is counter-productive (in revenue raising terms anyway) for Government. It explains why, if the aggregate earnings of everyone in the country is 100 taxing them at 20% might raise 19 but taxing them at 80% won’t raise 76. It explains how Ed Miliband’s Labour could argue that cutting income tax from 50% to 45% was a £3 billion tax cut for the wealthiest; the Coalition could respond that it would only cost £100m; and (on the best available evidence) they could both be right.

It’s also a useless insight. Of course, if your neighbour could work at what this rate was he could maximise the amount of plums he got to keep.

But he can’t. Tax theoreticians on the right argue a Laffer curve looks like this.

Capture

They argue that high tax rates disincentivise work, stimulate emigration and generate tax avoidance. And they’re right. They also argue that tax rates reduce economic growth – reducing the number of plums on the tree (loosely speaking). And they argue that the consequence is that the yield maximising rate is a low one.

Those on the left argue for one that looks like this.

Capture

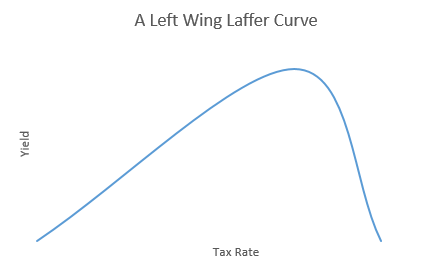
They agree high tax rates can disincentivise work, cause emigration and tax avoidance. But they argue these effects are overstated and that higher tax rates need not stunt growth. You can push tax rates much higher, they say. And they argue that those who can afford to pay more tax should do.

But this debate rarely rises above assertion and counter-assertion. Because what we know about the shape of the curve is precisely nothing.

We know that today, with our top rate of tax at 45% on income above £150,000, the 332,000 who earn above £150,000 will pay about £49.1bn in income tax in 2015-16 (Table 2.5 (2015-16)). But we don’t know what the world would have looked like today if, for example, Government hadn’t decided to raise our top rate from 40% in 2010-11.

Would there be more (or even fewer) than 332,000 people with income of above £150,000 paying income tax in the UK? Would they be earning more or less in aggregate that they do now? Would they have engaged in more or less tax avoidance? Has a 45% rate had a negative impact on economic growth – or more accurately earnings growth – or more accurately still earnings growth amongst very high earners? What are the effects of that increase on those earning below £150,000? We can speculate on any one of these effects. But unless we can speculate accurately about all of them – and we can’t – we can’t answer the question whether Government receives more in income tax now than had it stuck with a 40% rate.

We can’t construct a sensible counter-factual for the world as it might have been. And nor can we construct a sensible counterfactual for the world as it might be if we were to change rates tomorrow. But from the discourse on the left and right you’d be forgiven for thinking we could.

Here the left’s spokesman du jour Jeremy Corbyn:

Fair taxes for all – let the broadest shoulders bear the biggest burden to balance the books.

He might be right that the broadest shoulders should bear the biggest burden (and in a sense they already do: the highest earning 5,000 taxpayers pay a total of £9.43bn in income tax, or more than 5.5% of all income tax receipts). But it’s a non-sequitur to assert that raising taxes will balance the books, indeed if you tip into the downward slope of the curve you’ll further unbalance them.

And it bedevils much thinking on the right too – here’s Nigel Lawson talking of cutting the top rate to 40%:

I would strongly support this: It would significantly enhance the attractiveness of the UK as a place to do business, at no cost in terms of lost revenue.

That was the experience when I brought the top rate down to 40 per cent in 1988 and it is even more relevant today.

The (let us assume) fact that cutting the tax rate from 60% to 40% was revenue neutral absolutely does not have as its consequence that further tax cuts would be revenue neutral too. (You can test this hypothesis by looking on any Laffer Curve of the effects on yield of cutting tax rates from 20% to 0%).

The IFS’ pre-election estimate of the exchequer effects of raising the top rate from 45% to 50% doesn’t quite fall into this trap:

Capture

But it’s important to recognise that HMRC’s estimate from March 2012 (a document that still makes – if you’re of a certain mindset, anyway – for interesting reading) will be of very modest value now. The shape of the curve is affected by a variety of externalities that change over time. The marked success of the Coalition in tackling tax avoidance will reduce what I’ve referred to as dead-of-night fence-vaulting. Put shortly, it will have shifted the revenue maximising point to the right. So too, and markedly, will restrictions in pension tax relief for high earners. But the Coalition also adopted other tax measures which will have shifted the point to the left. And that’s before we move on to effects external to the UK.

I stress these points because they’re what I find most interesting. The political potency of the inequality narrative won’t diminish any time soon. And so the question whether to change income tax rates will continue to find its answer in political rather than fiscal considerations. Nigel Lawson knows this, of course. As (one imagines) do Corbyn’s advisers. Both are embarked on what virtue signalling looks to their respective supporter bases. But it’s no more than assertion: stay sentient folks.

But, as I sought to stress back when I was involved in Labour’s tax policy making, alongside the virtue signalling it’s worth considering how to maximise the yield from changing tax rates. This is a truth that applies to both upward and downward rate change – but I don’t get much sense that many policy makers think like this. Although we can’t know what a Laffer Curve looks like we can still seek to shape it in advance of rate changes. And that’s as universal a truth as you’re likely to find in tax rate policy.

Jeremy Corbyn and Pensioners

Writing in Tuesday’s Telegraph, Jeremy Corbyn said that nearly two million pensioners live in poverty. He called for an increase in the single tier state pension to the minimum income standard figure of £182.16 per week from £144 per week. This step, Corbyn said, would cost £22bn.

Do these claims stack up? Is this the right policy?

The article comprising the supposed source of the “nearly two million” claim (entitled, somewhat unhelpfully for Corbyn: ‘Pensioner poverty at an all time low – but the young lose out‘) contains no such figure. It does, however, give this chart

Capture

which (as the headline suggests) shows that pensioners as a demographic group are privileged: they have poverty rates of just above a half of the population as a whole. Indeed, as research released by the JRF on Tuesday revealed:

Median pensioner income (after housing costs) is now actually above that of the non-pensioner population

But what of the “nearly two million” claim?

Corbyn’s source article draws on research conducted by the JRF and released in November last year. If one looks at that research one finds (see page 26) figures for pensioner poverty of 1.6 million (using the DWP’s “contemporary measure”) or 1.8 million (using the “fixed measure”). But these figures date from 2012-13, since which time the basic state pension has risen by pretty much double the rate of inflation and so will overstate the number of pensioners in poverty. “Almost 2 million” looks a little like what some call ‘political rounding’ but others might call disingenuous.

Perhaps more importantly, the JRF research shows, again, that pensioners occupy, demographically, a uniquely privileged position.

Pensioner poverty is now at a record low level; from having a greater risk of poverty than the rest of the population in the 1980s, pensioners now have the lowest poverty of any age group. But as that has happened, poverty among working-age adults has risen, and has never been higher than it is now.

Of course, there is no such thing as good poverty. But the act of picking out the least poor demographic and showering it with non-means tested goodies requires some explanation. Not least because in 2012-13 (the figure will be even higher now) 87% of pensioners didn’t live in relative poverty. What is the case for benefiting them, whilst 3.7m or 4.1m (page 26) children live in poverty? Sadly Corbyn gives none.

What is the explanation for non-means tested benefits rather than targeted help for the poorest pensioners? Again, there is none.

Surely it can’t be found in the inclination of pensioners to vote? Surely?

As to the cost of raising the single tier state pension to £182.16 Corbyn gives this as £22bn. But he’s not at all clear how it will be funded: here’s what he says:

Capture

Illuminating, this is not.

Corbyn has previously argued for an increase in the top rate of income tax to 50p but of late seems to have backed off that a little. The only comprehensive research on what such an increase would raise suggests a yield of around £100m (less than half a percent of the £22bn needed). But that research is well out of date – and there isn’t room for sensible doubt but that the same measure in 2020 would raise significantly more. But there are limits to how much the rich can be taxed.  The UK is no longer in the 1980s  when personal income tax rates hit 60%. The make-up of our economy, the shape of our tax burden, the mobility of our highest earners, all of these things have changed. And changed in a way that makes it less rather than more easy to impose higher rates of tax on the rich.

£22bn is a big number – beyond that which can be yielded by increasing taxes on the income of the rich. And, purely for scale, to raise £22bn through the basic rate would involve increasing it by 6p.

And all to benefit the least disadvantaged demographic we have.

Perhaps there is another £22bn out there for those 4 million children living in poverty, and another £22bn for the 8 or 9 million working age adults also in poverty? Perhaps there is a brave new world in which all shall have prizes? And all funded by our favourite type of tax – the one paid by someone else? But if I’m to be asked to subscribe to the existence of such a utopia, I’d like to know a little more first about how it all stacks up.

The Tax Gap (Redux)

A week ago I published a short critique of the Corybnistas’ El Dorado: the £120bn Tax Gap. You can read it here. And you can read here the response to that critique published by Richard Murphy – the man named in the Corbyn Manifesto as being responsible for that estimate. I didn’t respond to Richard; I was happy to leave readers to make up their own minds.

Yesterday’s Times Editorial, too, took issue with that £120bn figure. It said it was a “fairytale” that £120bn could be raised by clamping down on evasion.

Richard Murphy took exception to that editorial here and this, pertinently, is what he said:

And then that suggestion that £120 billion can be collected: no one has said it; least of all me; least of all Jeremy. We have both pointed out the scale of the issue (I have heard him do so). But has anyone said we could get it all? Of course not: I have estimated £20 billion could be raised for an investment of £1 billion, or more. But The Times has just made the claim that all will be collected up.

In other words the ‘useful’ Tax Gap – the bit that it is said is practically collectable – is not £120bn but £20bn.

So three questions emerge: does the Corbyn Manifesto invite readers to conclude that £120bn is available; what is the source of the £20bn; and what sum might actually be available? Let me address those questions in turn.

The Corbyn Manifesto

What the Corbyn Manifesto says about the Tax Gap is this:

Capture

The Manifesto makes no mention – at all – of the fact that only a sixth of that £120bn is collectable. But it does talk of El Dorado yielding “enough to give every man, woman and child in the country £2,000.” You can make your own mind up about whether the Manifesto did intend to suggest that £120bn could be raised.

The source of the new £20bn figure

Richard and I are friends. But he is a prolific commentator and I do not manage to read all that he writes. So although I have no recollection of any previous work of his calculating a return of £20bn for an investment of £1bn it is possible that I have missed it. I invite Richard to direct me to those calculations. It would be a pity for the country if the Labour Party was invited to choose its leader and commit to a search for that fabled City on the basis of a finger in the air.

What might be collected

Writing in the comments section of last week’s Tax Gap post I observed:

To believe that there are huge revenues waiting to be collected – in other words that the tax gap is more than a KPI for HMRC and is an undeveloped and meaningful source of revenue – you have to swallow some pretty unlikely propositions. £120bn is about a fifth of all tax revenues. There is no political gain for any Government in just leaving that money lying there. It’s about what will be raised from the 40p rate and the 45p rate together in 2015/16. You have to believe that the Tories would rather leave that £120bn uncollected then cut the top rate of personal income tax to 20p. Respectfully, that defies plausibility. You also have to believe that the last Labour Government did this too: £120bn hugely exceeds gross per annum spending on the NHS in the last Labour Government; did Labour really choose just to leave that money lying on the ground?

So enormous was the initial estimate of £120bn that dividing it by six does not diminish the force of these points. £20bn is more than five times gross receipts from inheritance tax; it is a much higher multiple, still, of the yield from the 45p rate of income tax; and it is about seven times the bank levy. So to believe that there is £20bn waiting to be collected is to believe that Osborne has considered whether to abolish inheritance tax and the 45p rate and the bank levy and gain an extra £10bn and decided to do none of these but rather, instead, leave that £20bn uncollected. Is there any plausible world in which Osborne might make that political call?

Richard doesn’t seriously dispute that analysis. His view is that Osborne has deliberately made that policy choice. Here’s what he said on twitter:

And you either agree with that or you don’t. There’s no reasoning you out of it.

Now there is a serious argument that the Conservatives have under-invested in HMRC. FTE staff numbers are down by well over a third from 2005. And the Department is not protected against further cuts. It’s a peculiar choice to slash investment in your only revenue raising department at the same time as you seek to grow revenues. But sensibly estimating a theoretical yield from some theoretical extra investment? That’s a bit tough for me. But the fact that, as I pointed out here, the Tax Gap has remained stable in absolute terms (fallen in percentage terms) despite the cut in staff numbers does not suggest that there are huge net yields in store from raising investment.

Addendum

Note. Richard has responded to this post here. He links to his report on the Tax Gap and builds on some 2013 figures from ARC (the Union that represents senior staff in HMRC) which call for an extra £312m of investment that, they project, would deliver £8.26bn of tax (£26 for every £1 invested). You can read the ARC document here. The basis for ARC’s projections are not clear from the document.

Richard goes much further than ARC. He says that, in addition to ARC’s £312m, HMRC should spend a further £1bn which would yield £12 for every £1 invested. And £8.26bn plus 12 x £1bn gets you to £20bn. But no specific case for spending £1bn is advanced and nor does Richard offer any reasoning given for the projected 1,200% return on that £1bn.

Whilst, as my original post made clear, I think there is a strong case for examining the amount invested in HMRC I find it difficult to extrapolate from Richard’s post any evidential rationale for the supposedly realisable £20bn return.

Note

I am not accepting comments that do not make forensic points about the quality of my, or Richard’s, analysis. Where comments contain (but are not confined to) a forensic point I will edit them to remove all but that point and mark them as “edited”.

What Use the Tax Gap?

Every year HMRC publishes its estimate of the so-called Tax Gap.

What is it?

Capture

So the Tax Gap is predicated on Parliament’s intention in making the law. It measures (what HMRC considers to be) the difference between the tax Parliament intends should be collected and the tax HMRC actually collects. It doesn’t measure the tax that Parliament hasn’t asked HMRC to collect. So if Parliament doesn’t intend to levy, for example, a window tax the fact that there are no receipts from a window tax won’t make the Tax Gap bigger. If you wanted to measure the tax that might be collected if we had a window tax you’d first calculate the size of the Tax Gap – and then you’d add whatever yield a window tax might generate.

Another important thing to note about the Tax Gap is that it’s reasonably stable in both absolute and relative terms.

Capture

The latest estimate of the Tax Gap can be seen here. I’ve said it before and I’ll say it again: although it is inconvenient to Labour  – I am a Labour Party member and it is inconvenient to me – the Coalition did a reasonable job of shrinking the Tax Gap.

And HMRC are generally thought to be doing a pretty good job in measuring it. Here’s the NAO late last month:

Capture

Of course, it’s theoretically possible that HMRC and the National Audit Office and the IMF are all wrong and the Tax Gap is massively understated. Possible, but unlikely.

I apologise for labouring these points. But they’re important because, along with £93bn of so-called Corporate Welfare – which I’ve addressed at some length here – closing the Tax Gap forms a central plank of so-called Corbynomics.

Here’s what Corbyn says about it:

Capture

So is there really £2,000 for every man, woman and child in the country in closing the Tax Gap?

No. Unambiguously no.

Here’s how you get to that conclusion in three easy steps.

(1) There’s no worldwide conspiracy involving HMRC, the NAO and the IMF to hoodwink us as to the size of the Tax Gap. The Coalition Government wasn’t party to such a conspiracy – and neither was the last Labour government before it. HMRC does a decent job in calculating the size of the Tax Gap.

(2) The reason the Tax Gap is where it is is because it’s extremely difficult to close. Every Government ever has come into office saying it will tackle avoidance and evasion – but still we have a Tax Gap which is reasonably stable in amount. There are only two explanations for this. Either every Government ever has deliberately chosen to leave the Tax Gap where it is. Or try though you might a certain amount of leakage is inevitable and all you can hope to do is narrow the gap a bit. Those are your choices – and only one of them is plausible.

(3) Some other number might measure some other thing. It might measure what Parliament could levy if it changed the law. And that other number might even measure that thing plausibly. But raising £2,000 for every man, woman and child involves identifying what that change in the law is – a new window tax for example – and identifying how much it will raise. The extract from Corbyn’s manifesto given above – purportedly supporting the £120bn yield – doesn’t identify any new tax. And Corbyn’s record on calculating yield is poor: I give an example here.

So what use, then, is the Tax Gap? Well, HMRC tell us:

Capture

The mundane truth, I’m afraid, is that it’s a sophisticated performance metric for HMRC. It measures how well they’re doing and where they should target their resources.

The Tax Gap is not a serious tool for making broader economic policy. It is no magical pot of gold that will obviate the need for close engagement with the choices inherent in being in government. And it’s not a basis upon which you can pitch to a sentient electorate. It just isn’t.

Follow me @jolyonmaugham.